
FIGURE
Fig. S7
Fig. S7
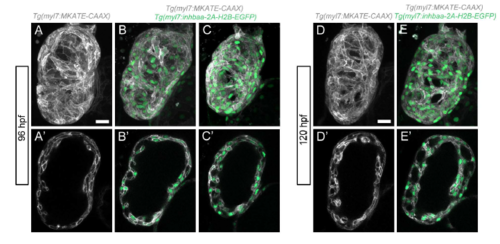
Increased trabeculation in Tg(myl7:inhbaa-2AH2B-EGFP) hearts at early larval stages. (A-C') 96 hpf Tg(myl7:MKATE-CAAX) control larva (A-A') and Tg(myl7:inbaa-2A-H2B-EGFP); Tg(myl7:MKATE-CAAX) larva with no obvious phenotype (B-B') or with signs of hypertrabeculation (C-C'). (D-E') 120 hpf Tg(myl7:MKATE-CAAX) control larva (D-D') and Tg(myl7:inhbaa-2A-H2B-EGFP), Tg(myl7:MKATE-CAAX) larva where increased trabeculation can be observed E-E'). Scale bars, 20 µm. |
Expression Data
Expression Detail
Antibody Labeling
Phenotype Data
Phenotype Detail
Acknowledgments
This image is the copyrighted work of the attributed author or publisher, and
ZFIN has permission only to display this image to its users.
Additional permissions should be obtained from the applicable author or publisher of the image.
Full text @ Development