
Fig. S3
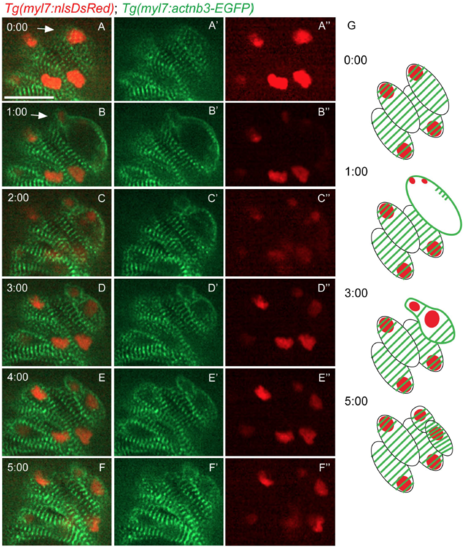
Sarcomere disassembly during cardiomyocyte division. Time-lapse live imaging starting from 80 hpf of a Tg(myl7:actn3b-EGFP); Tg(myl7:nlsDsRed) heart. (A-A") At t=0:00, striated sarcomeres were observed in all cardiomyocytes. (B-B") A cardiomyocyte is dividing (white arrow), and the EGFP signal is seen outlining the borders of the two nascent daughter cardiomyocytes. (C-C") Two daughter cells can be observed, but still the sarcomeres remain on the periphery of these new cardiomyocytes. (D-F") A recovery of the striated pattern in the newly formed cardiomyocytes is observed. (G) Schematic representation of the key time points of the sarcomere disassembly during cardiomyocyte division. Scale bars, 20 µm. |