
FIGURE
Fig. S2
Fig. S2
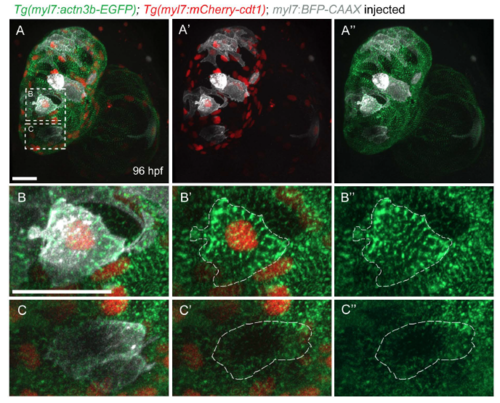
Sarcomere organization in G1 cardiomyocytes. (A-A") Three-dimentional reconstruction of a 96 hpf Tg(myl7:actn3b-EGFP); Tg(myl7:mcherry-cdt1) heart injected with myl7:BFP-CAAX plasmid to label individual cardiomyocytes. (B-B") Close-up of a cardiomyocyte in G1 phase, as labeled by mCherry+ nucleus; note the continuous sarcomeric striations throughout the cardiomyocyte. (C-C") Close-up of a myl7:mCherry-cdt1- cardiomyocyte; the sarcomeres do not occupy the whole cardiomyocyte, but are mostly located at the periphery of the cell. Scale bars, 20 µm. |
Expression Data
Expression Detail
Antibody Labeling
Phenotype Data
Phenotype Detail
Acknowledgments
This image is the copyrighted work of the attributed author or publisher, and
ZFIN has permission only to display this image to its users.
Additional permissions should be obtained from the applicable author or publisher of the image.
Full text @ Development