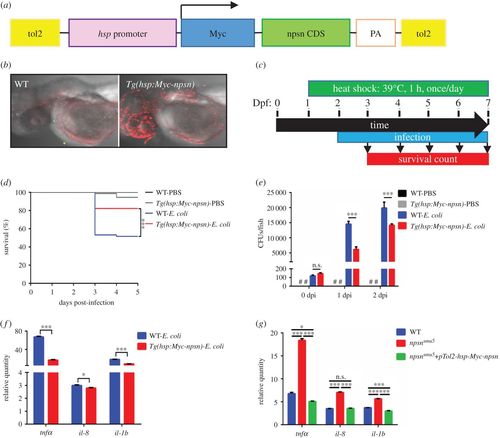
npsn overexpression enhances host response against E. coli infection. (a) Construction of the Tg(hsp:Myc-npsn) transgenic plasmid. npsn-CDS (green bar) was inserted behind the hsp promoter and a Myc tag. (b) Anti-Myc staining of the Tg(hsp:Myc-npsn) and WT embryos. (c) Scheme showing the experimental procedure used for the survival assays. Tg(hsp:Myc-npsn) and WT embryos were heat shocked at 39°C for 1 h at 1 day prior to infection. Embryos were infected with E. coli at 2 dpf via the yolk sac and heated to 39°C for 1 h daily, and the number of surviving larvae was counted daily over the next 5 days. (d) Survival curves for Tg(hsp:Myc-npsn) and WT embryos following injection with 100 CFUs of E. coli (WT (n = 60); Tg(hsp:Myc-npsn) (n = 60)). Statistical significance was determined using the log-rank test. ***p < 0.001. (e) Bacterial burden of embryos injected with E. coli. Less bacterial cells in Tg(hsp:Myc-npsn) at 1 and 2 dpi than in WT. Data were combined from three individual experiments (n = 50 per group), and statistical significance was determined using the two-way ANOVA with Bonferroni's multiple comparisons adjustment. ***p < 0.001. n.s., not significant. #, undetected. (f) Alteration of the inflammatory response in Tg(hsp:Myc-npsn) embryos at 2 hpi. The relative quantity of tnfα, il-8 and il-1b was examined by qRT-PCR, and expression levels were adjusted for trauma (PBS-solution injection). (Mean±s.e.m., n = 30 in each group, triplicated). Statistical significance was determined using the two-tailed Student's t-test. *p < 0.05. ***p < 0.001. (g) The altered expression of inflammatory cytokines could be rescued by npsn overexpression. The relative quantity of tnfα, il-8 and il-1b was examined by qRT-PCR, and expression levels were adjusted for trauma (PBS-solution injection). (Mean±s.e.m., n = 30 in each group, triplicated). Statistical significance was determined using the one-way ANOVA with Bonferroni's multiple comparisons adjustment. *p < 0.05. ***p < 0.001. n.s., not significant.
|
