
Fig. 5
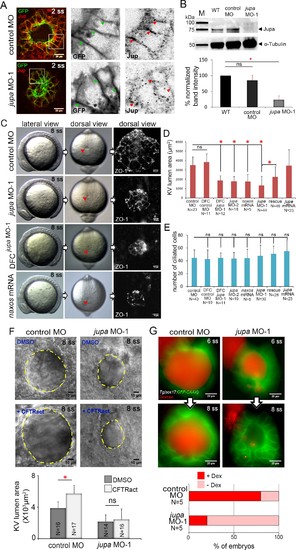
Interfering with Junction plakoglobin inhibits KV lumen expansion. (A) Immunostaining with Jup antibodies shows Jup enrichment at lateral membranes of KV cells marked by membrane-targeted GFP expression in Tg(sox17:GFP-CAAX) embryos. Embryos injected with jupa MO-1 showed reduced Jup protein levels. Boxes indicate enlarged regions shown as individual channels. Arrows point out representative lateral membranes. Scale = 20 μm. (B) Immunoblotting confirmed reduction in Jup protein level (arrowhead) in jupa MO-1 injected embryos relative to wild-type (WT) and control MO injected embryos. The graph shows normalized Jupa band intensities. Shown is the mean + SD for three independent experiments. (C) At 8 ss, control embryos showed an inflated KV lumen (red arrow) that was labeled using ZO-1 antibody staining. Embryos injected with jupa MO-1 to knockdown Jup expression in all cells (global knockdown) or specifically in DFC/KV cells (DFCjupa MO-1) appeared normal at 8 ss except that the KV lumen failed to expand. Interfering with Jup by injecting JUP-naxos mRNA also inhibited KV lumen expansion. Scale = 10 μm. (D) Quantification of KV lumen area in control and treated embryos at 8 ss. Co-injecting jupa MO-1 with jupa mRNA significantly rescued lumenogenesis defects. Shown are mean + SD for three independent experiments. (E) The number of ciliated KV cells was not different among the treatment groups. Shown is the mean + SD for results pooled from three independent experiments. (F) Representative images of at 8 ss in control and jupa MO injected embryos treated with vehicle (DMSO) or CFTRact-09. The graph shows KV lumen area (outlined by yellow line) in control and treated embryos. Scale = 10 μm. Shown is the mean + SD for two independent experiments.(G) Representative images of KV lumens of contro MO and jupa MO embryos injected with rhodamine-dextran. Scale = 20 μm. The graph shows percentage of embryos retaining and losing the fluorescent dye between 6 ss and 8 ss from two independent trials. N = number of embryos analyzed. *p<0.01 and ns = not significant (p>5% with Welch’s T-Test). |
| Gene: | |
|---|---|
| Fish: | |
| Knockdown Reagents: | |
| Anatomical Term: | |
| Stage: | 1-4 somites |
| Fish: | |
|---|---|
| Condition: | |
| Knockdown Reagents: | |
| Observed In: | |
| Stage: | 5-9 somites |