
Fig. 3
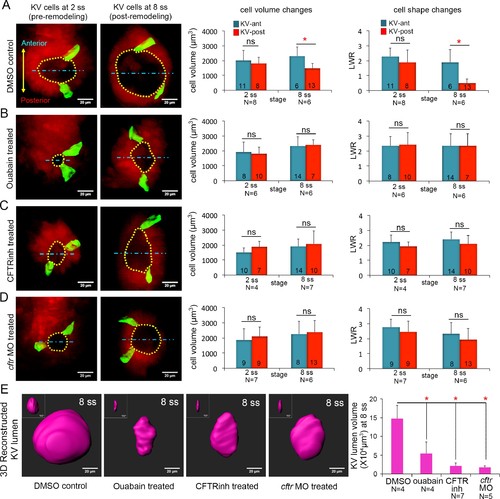
Ion channel activity mediates asymmetric KV cell volume changes, KV lumen expansion and KV cell shape changes. (A) 3D reconstructed KV-ant and KV-post cells in mosaic labeled Tg(sox17:CreERT2); Tg(ubi:Zebrabow) control embryos (treated with vehicle DMSO) showed asymmetric cell volume changes and asymmetric cell shape changes (length-to-width ratio) between 2 ss and 8 ss. (B) Inhibiting the Na+/K+-ATPase with ouabain treatments reduced KV lumen expansion and disrupted asymmetric cell volume changes. KV cells in ouabain treated embryos did not undergo asymmetric shape changes. (C–D) Interfering with Cftr function using the small molecule inhibitor CFTRinh-172 (C) or cftr MO (D) also blocked KV lumenogenesis and disrupted asymmetric cell volume changes and shape changes of KV cells. (E) Quantification of 3D reconstructed KV lumen volumes (insets depict lumen in YZ axis) in control and treated live embryos at 8 ss. For all quantitative analyses, the mean + SD is shown. The number of KV-ant and KV-post cells analyzed is indicated in the graphs in A-D. N = number of embryos analyzed. Results were pooled from two independent trials. Scale = 20 μm, *p<0.01 and ns = not significant (p>5% with Welch’s T-Test). |
| Genes: | |
|---|---|
| Fish: | |
| Conditions: | |
| Knockdown Reagents: | |
| Anatomical Terms: | |
| Stage Range: | 1-4 somites to 5-9 somites |
| Fish: | |
|---|---|
| Conditions: | |
| Knockdown Reagents: | |
| Observed In: | |
| Stage: | 5-9 somites |