
FIGURE
Fig. 3-S1
Fig. 3-S1
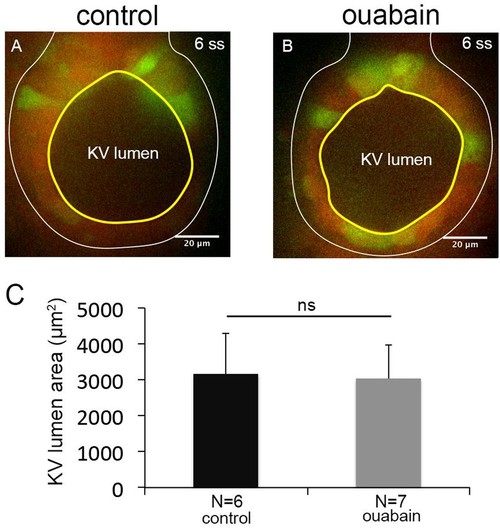
Ouabain treatments between 4–6 ss do not block KV lumen expansion. (A–B) Mosaic-labeled KV in a control embryo (A) and an embryo treated with ouabain from 4 to 6 ss (B). (C) Measurements of maximum KV lumen area indicated that ouabain treatments between 4–6 ss were not effective at blocking KV lumen expansion. N = number of embryos analyzed. Shown is the mean + SD. ns = not significant (p>5% with Welch’s T-Test). |
Expression Data
Expression Detail
Antibody Labeling
Phenotype Data
Phenotype Detail
Acknowledgments
This image is the copyrighted work of the attributed author or publisher, and
ZFIN has permission only to display this image to its users.
Additional permissions should be obtained from the applicable author or publisher of the image.
Full text @ Elife