|
Transient Hypertrophy and Polyploidy in Regenerating Epicardial Cells
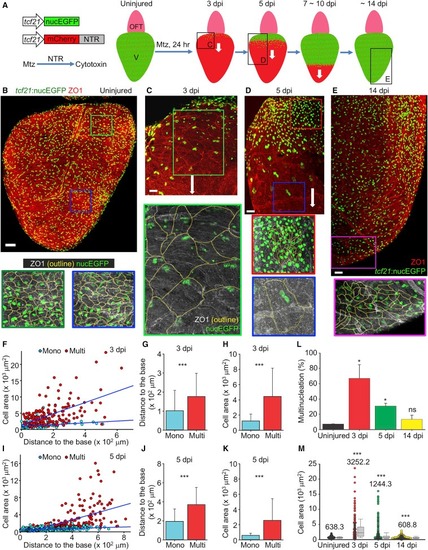
(A) Schematic for epicardial ablation and regeneration in vivo. White arrows indicate the direction of regeneration. OFT, outflow tract; V, ventricle. The frames with letters indicate regions shown in (C) to (E).
(B) Flattened images of a whole-mounted uninjured heart stained with an anti-ZO1 antibody (red). Framed regions are enlarged below in the same scale as the enlarged panels of (C) to (E). ZO1 staining is outlined by dashed lines. Scale bar, 100 μm.
(C–E) Flattened images of whole-mounted adult hearts at 3 dpi (C), 5 dpi (D), and 14 dpi (E) stained with an anti-ZO1 antibody (red). Framed regions are enlarged below in the same scale, with epicardial ZO1 staining outlined by dashed lines. White arrows indicate the direction of regeneration. Scale bars, 50 μm.
(F–H) Quantifications of epicardial cell area and distance from the ventricular base at 3 dpi. Mononucleate cells (Mono) are represented by cyan dots (F) or bars (G and H), and multinucleate cells (Multi) by red dots (F) or bars (G and H). n = 94 for Mono and 161 for Multi. The blue lines in (F) show regression results for Mono and Multi, respectively. (F) p < 0.001, ANCOVA. (G and H) ∗∗∗p < 0.001, Mann-Whitney rank-sum test. Error bars indicate mean ± SD.
(I–K) Similar quantifications as (F) to (H), using samples at 5 dpi. n = 401 for Mono and 198 for Multi. (I) p < 0.001, ANCOVA. (J and K) ∗∗∗p < 0.001, Mann-Whitney rank-sum test. Error bars indicate mean ± SD.
(L) Quantification of multinucleation for uninjured and 3-, 5-, and 14-dpi hearts. n = 4 (uninjured), 5 (3 dpi), 4 (5 dpi), and 3 (14 dpi) hearts, respectively. ∗p < 0.05; ns, not significant; Mann-Whitney rank-sum test. Error bars indicate mean ± SD.
(M) Quantification of cell area distribution for uninjured and 3-, 5-, and 14-dpi hearts. n = 449 (uninjured), 255 (3 dpi), 599 (5 dpi) and 1,678 (14 dpi), respectively. Numbers on the plot indicate mean values. ∗∗∗p < 0.001, Mann-Whitney rank-sum test. Error bars indicate SD
See also Figures S1 and S2; Movie S1.
|