|
High Regenerative Capacity in Endoreplicated Cells
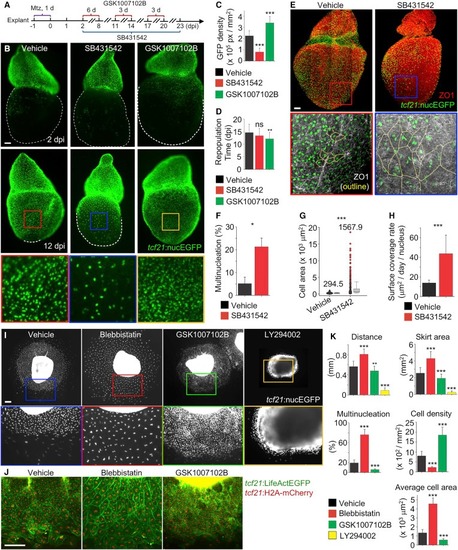
(A) Schematic for experiments in (B) to (H). tcf21:NTR; tcf21:nucEGFP animals were used.
(B) Epicardial regeneration ex vivo in the presence of DMSO (vehicle), 10 μm SB431542, or 0.5 μm GSK1007102B. White dashed lines outline the explants. Framed regions are enlarged to show details below. Scale bar, 100 μm.
(C) Quantification of GFP fluorescence density from images captured at 12 dpi. n = 18 (vehicle), 18 (SB431542), and 13 (GSK1007102B), respectively. ∗∗∗p < 0.001, Student's t test (compared with vehicle). Error bars indicate mean ± SD.
(D) Quantification of timing to repopulate the ablated ventricular surface. n = 36 (vehicle), 26 (SB431542), and 21 (GSK1007102B), respectively. ∗∗p < 0.01; ns, not significant; Mann-Whitney rank-sum test (compared with vehicle). Error bars indicate mean ± SD.
(E) Flattened images of whole-mounted hearts with ZO1 staining (red). Hearts were treated with DMSO (vehicle) or SB431542 for 12 days (14 dpi). Framed regions are enlarged below, with nucEGFP shown in green, and ZO1 in grayscale and outlined in yellow. Scale bar, 100 μm.
(F) Quantification of epicardial cell multinucleation in hearts treated with DMSO (vehicle) or SB431542 for 12 days (14 dpi). n = 4 hearts for each. ∗p < 0.05, Mann-Whitney rank-sum test. Error bars indicate mean ± SD.
(G) Quantification of epicardial cell area in hearts treated with DMSO (vehicle) or SB431542 for 12 days (14 dpi). n = 822 (vehicle) and n = 477 (SB431542). Numbers on the plot indicate mean values. ∗∗∗p < 0.001, Mann-Whitney rank-sum test. Error bars indicate SD.
(H) Regenerative capacity on a per cell basis, with or without SB431542 treatment, measured by area covered per day by a digitalized nucleus. Area was measured at day 0 (2 dpi) and day 10 (12 dpi) of treatment, and cell density was measured at day 10 (12 dpi). One digitalized nucleus is defined as 30 GFP pixels. n = 18 explants for each group. ∗∗∗p < 0.001, Mann-Whitney rank-sum test. Error bars indicate mean ± SD.
(I) Epicardial explant culture assays with vehicle, blebbistatin (10 μM), GSK1007102B (0.5 μM), or LY294002 (50 μM) treatment. tcf21:nucEGFP explants (shown in white) were plated for 5 days. Blebbistatin was added from day 3 to day 5, and GSK1007102B and LY294002 were added from day 0 to day 5. Framed regions are enlarged below to show details. Scale bar, 200 μm.
(J) Experiment as in (H) using tcf21:LifeAct-EGFP; tcf21:H2A-mCherry
(K) Quantification of epicardial growth. Skirt area is defined as the area covered by epicardial tissue growth from the explant. For migration distance and skirt area, n = 40 (vehicle), 30 (blebbistatin), 27 (GSK1007102B), and 19 (LY294002) explants, respectively. For nucleation, cell density, and average cell area, n = 10 explants for each treatment. ∗∗∗p < 0.001; ∗∗p < 0.01; Student's t test for migration distance and skirt area, Mann-Whitney rank-sum test for cell density, nucleation, and average cell area. All comparisons were versus vehicle-treated group. Error bars indicate mean ± SD.
See also Figures S6 and S7; Movie S8.
|