|
Endomitosis and Endocycling Events Underlie Epicardial Cell Polyploidy
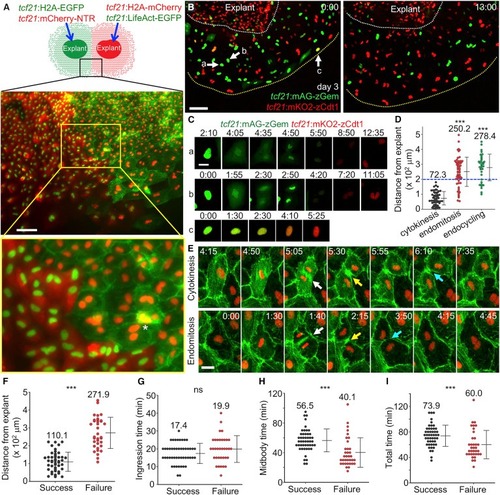
(A) (Top) Schematic of experimental design to detect epicardial cell fusion. (Middle) Image of the framed region represented in the cartoon acquired after 5 days of culture. (Bottom) The region framed in yellow, enlarged to show detail. Asterisk indicates actin meshwork (green) covering a red nucleus, not a fused cell. Scale bar, 100 μm.
(B) Video frames of FUCCI cell-cycle analysis of explanted epicardial cells. A 3-day culture of an explant carrying FUCCI reporters was subjected to live imaging for 13 hr. White dashed lines outline the explant and yellow dashed lines outline the leading edge. Arrows and lowercase letters denote nuclei shown in (C). Scale bar, 100 μm.
(C) Video frames of the nuclei highlighted in (B) showing cytokinesis (cell a), endomitosis (cell b), and endocycling (cell c). Timing, hr:min. Scale bar, 20 μm.
(D) Spatial distribution of cell-cycle behaviors. Cell positions were calculated at the point of nuclear membrane breakdown (for cytokinesis and endomitosis) or fluorescent change from green to red (for endocycling). n = 56 (cytokinesis), 59 (endomitosis), and 35 (endocycling), respectively. Numbers on the plot indicate mean values. Blue dashed line marks 200-μm position. ∗∗∗p < 0.001, Mann-Whitney rank-sum test (compared with cytokinesis). Error bars indicate mean ± SD.
(E) Video frames of explanted epicardial cells from a tcf21:LifeAct-EGFP; tcf21:H2A-mCherry line showing normal cytokinesis (top) and cytokinesis failure in an endomitotic cell (bottom). White arrows indicate start of cleavage furrow ingression, yellow arrows indicate formation of midbodies, and cyan arrows indicate furrow abscission or regression. Timing, hr:min. Scale bar, 20 μm.
(F) Spatial distribution of successful and failed cytokinesis. Cell positions were calculated at the point of nuclear membrane breakdown. n = 48 (Success) and n = 35 (Failure). Numbers on the plot indicate mean values. ∗∗∗p < 0.001, Mann-Whitney rank-sum test. Error bars indicate mean ± SD.
(G–I) Quantifications of the durations for cleavage furrow ingression (G), midbody formation (H), and the total time of both (I), for successful and failed cytokinesis, respectively. Ingression time is defined as the time from the dense LifeAct-EGFP signal emergence between two daughter nuclei (white arrows in E) to the formation of the narrowest furrow (yellow arrows in E). Midbody time was defined as the time from the narrowest furrow formation to furrow abscission or furrow regression (cyan arrows in E). n = 48 (Success) and n = 35 (Failure). Numbers on the plot indicate mean values. ∗∗∗p < 0.001; ns, not significant; Mann-Whitney rank-sum test. Error bars indicate mean ± SD.
See also Figure S4 and Movies S2–S5.
|