
Fig. S1
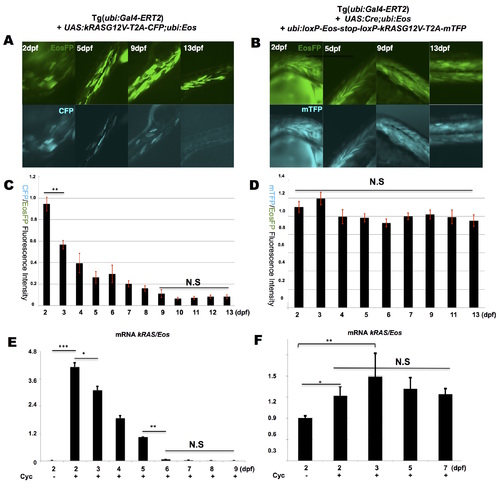
Dynamic profile of kRASG12V expression over time following transient and constitutive cyclofen activation. Transient kRASG12V induction was achieved by injecting UAS:kRASG12V-T2A-CFP; ubi:Eos plasmid into Tg(ubi:Gal4-ERT2) embryos followed by a transient incubation in cyclofen. Constitutive induction was achieved by co-injecting UAS:Cre; ubi:Eos and ubi:loxP-Eos-loxP-kRASG12V-T2A-mTFP plasmids into Tg(ubi:Gal4-ERT2) embryos followed by a transient incubation in cyclofen. (A, B) The fluorescent expression of both EosFP and CFP (or mTFP) co-expressed with kRASG12V was imaged over 13 days. Quantitative measurements of the fluorescent intensity and qPCR analysis (of kRASG12V transcripts) displayed a gradual decrease of kRASG12V expression upon transient induction (C, E), and a stable kRASG12V expression upon constitutive induction (D, F). Scale bar: 400 μm. Data are presented as mean ± SEM. ***p < 0.001; **p < 0.01; *p < 0.05; N.S, not significant. |