
Fig. 1
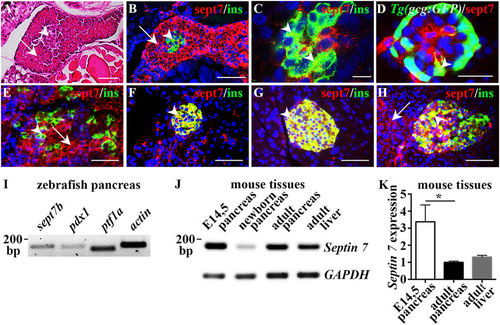
Expression of septin 7 in vertebrate pancreas. (A) Longitudinal section of 4 dpf zebrafish larva stained with hematoxylin and eosin shows endocrine (arrowhead) and exocrine cells (arrow). (B) Longitudinal section of 4 dpf zebrafish larva immunostained for septin 7 (red) and insulin (green) shows cytoplasmic localization of septin 7 in exocrine cells (arrow) and β-cells positive for insulin (arrowhead). (C) Confocal image of a 4 dpf zebrafish larvae immunostained as whole-mount for septin 7 (red) and insulin (green) confirms that septin 7 is expressed in β-cells (arrowheads). (D) Confocal image of 4 dpf Tg(gcg:GFP) zebrafish larva stained as whole mount shows localization of septin 7 (red) in glucagon-positive α-cells (arrowhead). (E) Septin 7 (red) shows cytoplasmic localization in E14.5 mouse pancreas in β-cells (arrowhead) stained for insulin (green) and in exocrine cells (arrow). (F,G) Septin 7 (red) concentrates in the islets (arrowheads) of newborn (F) and adult (G) mouse pancreas. Staining for insulin (green) visualizes β-cells. (H) In adult human pancreas septin 7 (red) localizes in the islets (arrowhead). Staining for insulin (green) visualizes β-cells. A few exocrine cells are also positive for septin 7 (arrow). In (B–H), nuclei are labeled with DAPI (blue). (I) RT-PCR confirms the expression of sept7b in adult zebrafish pancreas along with pdx1, ptf1a, and actin. (J) RT-PCR confirms the expression of Septin 7 in embryonic day 14.5 (E14.5), newborn and adult pancreas and adult liver in mouse. GAPDH is used as a control. (K) Quantitative RT-PCR shows that the expression of Septin 7 is 3-fold higher in embryonic pancreas than in the adult pancreas and liver. The difference in the expression level of Septin 7 in the adult liver and adult pancreas is not significant. The expression of Septin 7 was normalized to Cyclophilin G. Error bars represent mean ± SEM (n = 4–5). *p ≤ 0.05. Scale bar: (A) (25 μM), (B) (30 μM), (C) (7.5 μm), (D) (10 μm), (E–H) (30 μm). |
| Genes: | |
|---|---|
| Antibodies: | |
| Fish: | |
| Anatomical Terms: | |
| Stage Range: | Day 4 to Adult |