
FIGURE
Fig. S6
- ID
- ZDB-FIG-170921-67
- Publication
- Uriu et al., 2017 - A framework for quantification and physical modeling of cell mixing applied to oscillator synchronization in vertebrate somitogenesis
- Other Figures
- All Figure Page
- Back to All Figure Page
Fig. S6
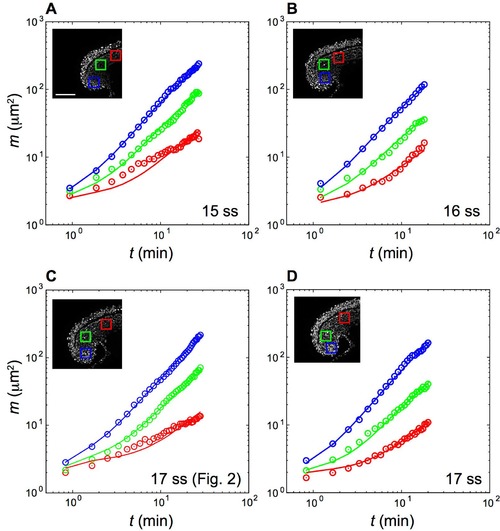
Quantification of cell mixing in the 15-17 somite stage zebrafish embryos by the mean squared difference of displacement vectors (MSDD). (A)-(D) Time evolution of the MSDDs for (A) 15 somite stage (ss), (B) 16 ss and (C),(D) 17 ss embryos. Circles represent experimental data. Lines are fitting by the physical model of cell movement to the experimental data. The colored boxes in the inset images indicate the regions for which the MSDD was calculated. The color code of the MSDD matches that of the boxes. The values of parameters in the model are listed in Tables S1 and S2. Scale bar = 100 μm in (A). |
Expression Data
Expression Detail
Antibody Labeling
Phenotype Data
Phenotype Detail
Acknowledgments
This image is the copyrighted work of the attributed author or publisher, and
ZFIN has permission only to display this image to its users.
Additional permissions should be obtained from the applicable author or publisher of the image.
Full text @ Biol. Open