
FIGURE
Fig. S7
- ID
- ZDB-FIG-170921-66
- Publication
- Uriu et al., 2017 - A framework for quantification and physical modeling of cell mixing applied to oscillator synchronization in vertebrate somitogenesis
- Other Figures
- All Figure Page
- Back to All Figure Page
Fig. S7
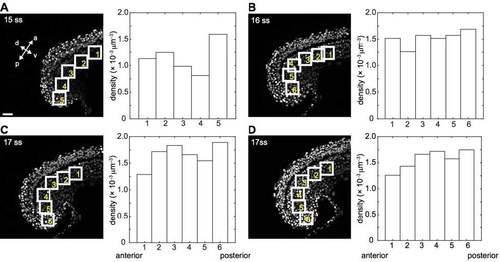
Nuclear density across the tailbud and PSM for the four embryos. (A)-(D) Snapshot image (left) and nuclear density (right) for (A) 15 somite stage (ss), (B) 16 ss and (C), (D) 17 ss embryos. Numbers in the six (five in (A)) white boxes correspond to those in the right bar charts. 1 (anterior most) to 6 (tailbud). Scale bar = 50 μm in (A). |
Expression Data
Expression Detail
Antibody Labeling
Phenotype Data
Phenotype Detail
Acknowledgments
This image is the copyrighted work of the attributed author or publisher, and
ZFIN has permission only to display this image to its users.
Additional permissions should be obtained from the applicable author or publisher of the image.
Full text @ Biol. Open