
FIGURE
Fig. 2
- ID
- ZDB-FIG-170921-65
- Publication
- Uriu et al., 2017 - A framework for quantification and physical modeling of cell mixing applied to oscillator synchronization in vertebrate somitogenesis
- Other Figures
- All Figure Page
- Back to All Figure Page
Fig. 2
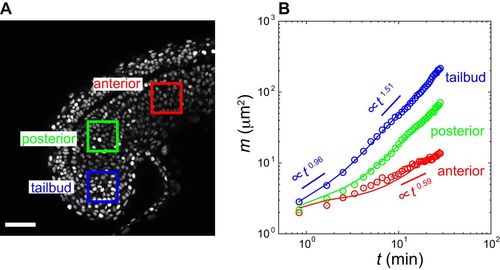
Quantification of cell mixing by MSDD. (A) Snapshot of a 17 ss embryo. Colored boxes indicate regions for which MSDD was calculated in B. (B) MSDD computed from Eqn 3 at each region of PSM and tailbud as a function of time. Circles represent experimental data. Lines are fit by the physical model of cell movement to experimental data. Tables S1 and S2 give parameter values in the physical model. Scale bar: 50 μm. |
Expression Data
Expression Detail
Antibody Labeling
Phenotype Data
Phenotype Detail
Acknowledgments
This image is the copyrighted work of the attributed author or publisher, and
ZFIN has permission only to display this image to its users.
Additional permissions should be obtained from the applicable author or publisher of the image.
Full text @ Biol. Open