
- Title
-
A framework for quantification and physical modeling of cell mixing applied to oscillator synchronization in vertebrate somitogenesis
- Authors
- Uriu, K., Bhavna, R., Oates, A.C., Morelli, L.G.
- Source
- Full text @ Biol. Open
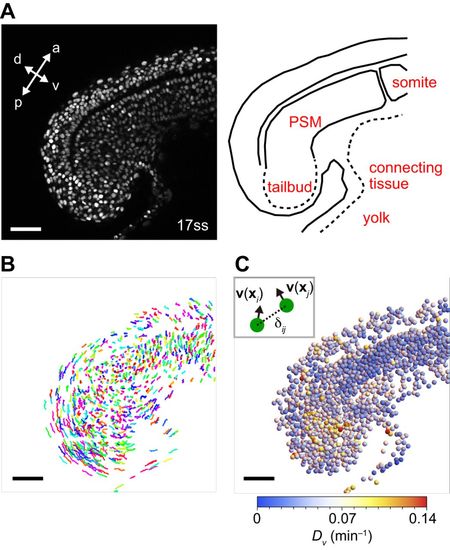
Quantification of cell mixing by the average directional derivative modulus of cell velocity vectors. (A) Left: Snapshot of a 17 ss embryo, with nuclei labeled with Histone h2AflV-gfp. a, anterior; p, posterior; d, dorsal; v, ventral. Right: schematic picture of PSM and tailbud. See also Movie 1. (B) Cell trajectories for the embryo shown in A, obtained by nuclear detection and tracking algorithms. Trajectories from time frame 1 to 20 (16.7 min) plotted in three-dimensional space. Each trajectory is assigned a color randomly. (C) Spatial profile of average directional derivative modulus of cell velocity vectors Dv for the 17 ss embryo shown in A. Spheres represent the positions of cells (radius chosen for better visibility). Scale bars: 50 μm. |
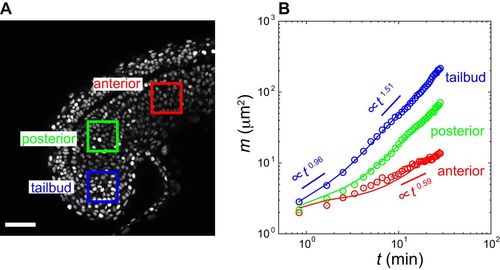
Quantification of cell mixing by MSDD. (A) Snapshot of a 17 ss embryo. Colored boxes indicate regions for which MSDD was calculated in B. (B) MSDD computed from Eqn 3 at each region of PSM and tailbud as a function of time. Circles represent experimental data. Lines are fit by the physical model of cell movement to experimental data. Tables S1 and S2 give parameter values in the physical model. Scale bar: 50 μm. |
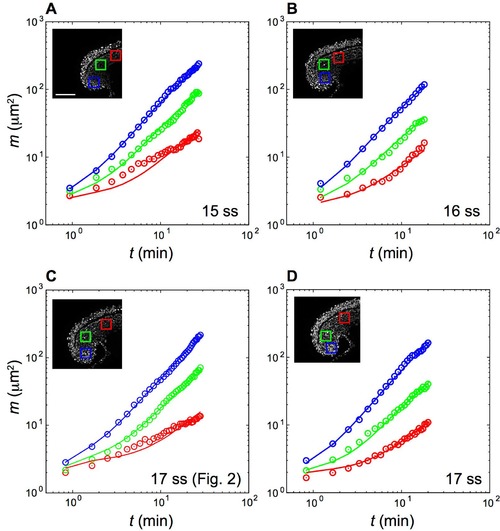
Quantification of cell mixing in the 15-17 somite stage zebrafish embryos by the mean squared difference of displacement vectors (MSDD). (A)-(D) Time evolution of the MSDDs for (A) 15 somite stage (ss), (B) 16 ss and (C),(D) 17 ss embryos. Circles represent experimental data. Lines are fitting by the physical model of cell movement to the experimental data. The colored boxes in the inset images indicate the regions for which the MSDD was calculated. The color code of the MSDD matches that of the boxes. The values of parameters in the model are listed in Tables S1 and S2. Scale bar = 100 μm in (A). |
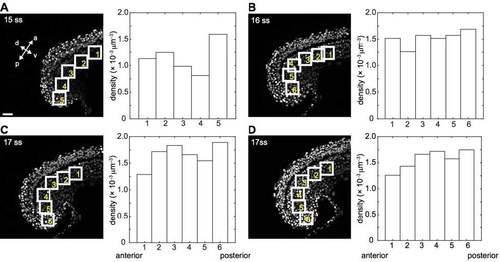
Nuclear density across the tailbud and PSM for the four embryos. (A)-(D) Snapshot image (left) and nuclear density (right) for (A) 15 somite stage (ss), (B) 16 ss and (C), (D) 17 ss embryos. Numbers in the six (five in (A)) white boxes correspond to those in the right bar charts. 1 (anterior most) to 6 (tailbud). Scale bar = 50 μm in (A). |