
Fig. S4
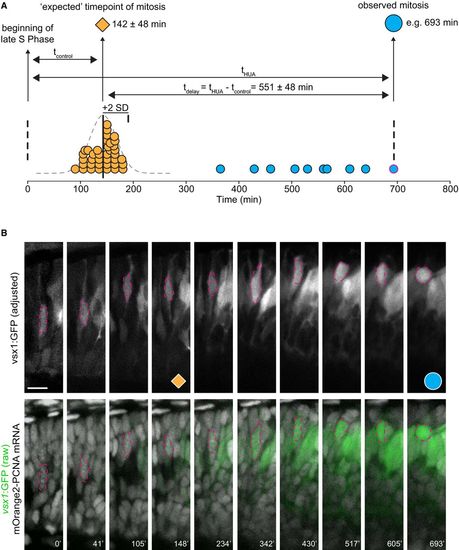
mOrange2‐PCNA allows for studying HUA‐induced delay of mitosis A. Time‐lapse imaging of vsx1:GFP retinas expressing mOrange2‐PCNA was used to determine the time interval between the beginning of late S‐phase and the beginning of M‐phase for progenitors. In control fish the average time for this interval was 142 ± 48 min (mean ± 2 standard deviations, SD, 38 cells from six fish, orange circles represent single cells). HUA‐treated progenitors were significantly delayed compared to controls, with an average time interval of 534 ± 32 min (10 cells from four fish, P < 0.0001, Mann–Whitney U‐test, cyan circles). The delay with which each of the 10 HUA‐treated progenitors reached M‐phase was calculated by subtracting the average “expected” time interval between S‐ and M‐phase (obtained from control cells, orange diamond) from the observed time interval between S‐ and M‐phase for each HUA‐treated progenitor (cyan circles). An example of this calculation for the cell tracked in (B) is shown. B. Time‐lapse confocal images of a HUA‐treated vsx1:GFP retina expressing mOrange2‐PCNA. Based on control experiments, the outlined cell (for which the delay in mitosis is depicted in A, cyan cell with a pink outline) would have been “expected” to undergo mitotic division around the 148 min time point (orange diamond; closest to the calculated mean “expected” time of 142 min), but entered M‐phase at 693 min (cyan circle). Scale bar: 10 μm. |