
Fig. 4
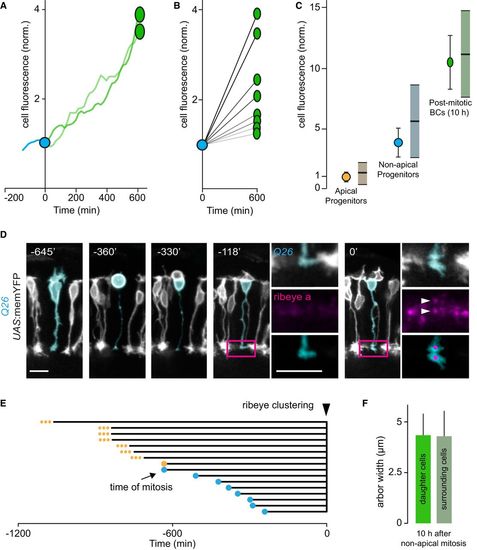
The differentiation status of late‐born bipolar cells and earlier‐born bipolar cells in their vicinity are similar A. Fluorescence intensity of a non‐apically dividing vsx1+ progenitor before it undergoes mitotic division (cyan trace), at the time of mitotic division (cyan circle) and of the two BC daughter cells (green ovals) over the course of 10 h (green traces). B. Quantification of the fluorescence intensity of four pairs of BC daughters (green ovals) derived from non‐apically dividing vsx1+ progenitors (cyan circle) 10 h after division. The fluorescence intensity of each of the BC pairs was normalized to the mitotic cell from which they were derived. BC pairs depicted are derived from two fish. The different overall rates of GFP fluorescence increase can be explained by where along the differentiation gradient cells originate. C. Comparison of the vsx1 expression levels of apical progenitors, non‐apical progenitors, and post‐mitotic BCs derived from non‐apically dividing progenitors 10 h following division. The fluorescence expression levels of cells surrounding each of the three cell categories are also quantified. Apically dividing vsx1+ progenitors (orange circle) and surrounding cells (dull orange bar, mean, and standard deviation, SD). Non‐apically dividing vsx1+ progenitors (cyan circle) and surrounding cells (dull cyan bar, mean, and SD). In total, 43 apically dividing progenitors and 524 cells in their surround, and 43 non‐apically dividing progenitors and 521 cells in their surround from at least 13 eyes were used for this analysis. Post‐mitotic BCs (green oval) and earlier‐born surrounding cells (dull green bar, mean, and standard deviation). Eleven post‐mitotic BCs derived from seven mitotic divisions and 105 cells in their surround from three fish were used for this analysis. D. Confocal in vivo time‐lapse recording of the emergence of ribeye a puncta (pseudo‐colored magenta, ctbp2:mCherry‐ctbp2) in a BC derived from a non‐apically dividing vsx1+ progenitor (pseudo‐colored cyan, Q26; UAS:memYFP), 7 h following cell cycle exit. Insets of the magenta‐boxed region (at −118′ and 0′) of the axon terminal of the BC reveal the emergence of discernible ribeye a puncta at the 0′ time point (white arrowheads). Scale bars: 10 μm. E. Quantification of the time interval between mitosis and clustering of ribeye puncta (triangle) in the axon terminals of the ensuing BC daughters. Eight BCs derived from seven non‐apically dividing progenitors (cyan circles) and eight BCs derived from apically dividing vsx1+ progenitors (orange circles) from three fish were used for this analysis. In seven of the eight BCs derived from apical progenitors (depicted as small orange dots), we observed clustering but not the mitotic division, thus the time interval in these cases is an underestimate. F. Quantification of the axon terminal arbor width of BCs derived from non‐apical vsx1+ progenitors and the cells in their surround. At 10 h post‐division, mean arbor width for BCs was 4.34 ± 1.05 μm, SD; the mean arbor width for cells in their surround was 4.29 ± 1.24 μm, SD. In total, nine BCs derived from seven non‐apical divisions and 56 surround cells from six fish were used for analysis. |