
Fig. 1
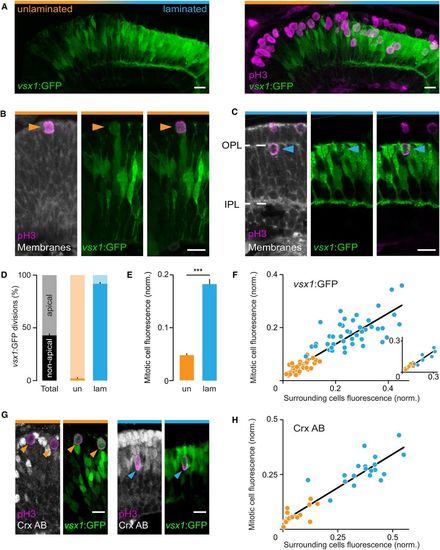
Vsx1+ progenitors undergo mitosis in different proliferative zones and match the expression of molecular markers of post‐mitotic BCs in their vicinity A. Confocal images of a coronal cryostat section from a 2 dpf vsx1:GFP retina with immature, neuroepithelial (“unlaminated”, orange) and mature, laminated regions (“laminated”, cyan). Left panel, vsx1:GFP; right panel, vsx1:GFP shown in conjunction with pH3 antibody staining to label cells in late G2/M‐phase. Scale bar: 10 μm. B, C High magnification images of (B) an apically dividing vsx1+ progenitor (orange arrowhead) in an unlaminated region where cells span the retina and express GFP weakly and (C) a non‐apically dividing vsx1+ progenitor (cyan arrowhead) in a laminated region where cells confine their processes to the OPL and IPL (dashed lines) and express high levels of GFP. Cellular membranes are labeled with BODIPY methyl ester. Scale bar: 10 μm. D. Quantification of vsx1+ progenitor mitoses at apical (lightly shaded) and non‐apical (darkly shaded) locations in the unlaminated (“un”, orange) and laminated (“lam”, cyan) retina. Data are presented as mean ± SEM, 1,391 mitotic divisions, 80 sections from at least 14 fish. E. Quantification of vsx1:GFP fluorescence intensity in dividing vsx1+ progenitors in the unlaminated (“un”, orange) and laminated (“lam”, cyan) retina. Data are presented as mean ± SEM, 86 progenitors, 43 sections from at least 13 eyes, Mann–Whitney U‐test, ***P ≤ 0.0001. F. Correlation of vsx1:GFP fluorescence intensity in progenitors and their surrounding cells in the unlaminated (orange circles) and laminated (cyan circles) regions of the retina. Eighty‐six progenitors from 43 sections from at least 13 eyes, r2 = 0.78. Inset: Analysis for all pH3+ cells (n = 13) from a single section. G. Confocal images of a cryostat section from a 2 dpf vsx1:GFP retina immunostained with antibodies against pH3 and Crx. Vsx1+ progenitors (GFP+ pH3+) are Crx negative (orange arrowheads) in the unlaminated retina (left panels, orange bars above panels) and are Crx positive (cyan arrowhead) in the laminated region (right panels, cyan bars above panels). Scale bar: 10 μm. H. Correlation of Crx antibody staining intensity between mitotic BC progenitors and the vsx1+ cells in their vicinity. Thirty‐eight progenitors, 10 sections from at least five eyes, r2 = 0.87; orange circles, apical mitoses; cyan circles, non‐apical mitoses. |