
Fig. S1
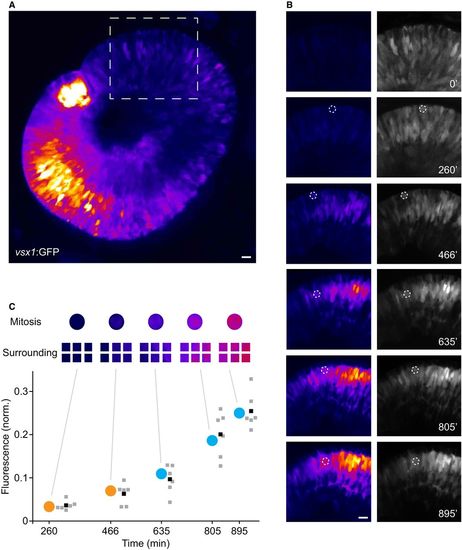
In vivo time‐lapse recording of dividing BC progenitors in a vsx1:GFP retina A.Confocal in vivo image of a 2 dpf vsx1:GFP retina. Expression of GFP, depicted using a “Fire” look‐up table (LUT), follows the retinal differentiation gradient, appearing first in the ventro‐nasal patch and subsequently in the nasal, dorsal, and temporal parts of the retina. Scale bar: 10 μm. B.Time‐lapse images of the boxed region in (A). Left panels represent the raw levels of GFP fluorescence (Fire LUT). Right panels depict GFP fluorescence adjusted for better visualization (gray). Dashed circles mark mitotic events. Scale bar: 10 μm. C. Individual mitotic events marked in (B) at progressively later times during development. GFP fluorescence levels of the mitotic progenitors and that of six cells in their surround. Orange circles, apical mitotic divisions; cyan circles, non‐apical mitotic divisions; gray squares, individual surrounding cells; black squares, average fluorescence of surrounding cells. |