
FIGURE
Fig. S2
Fig. S2
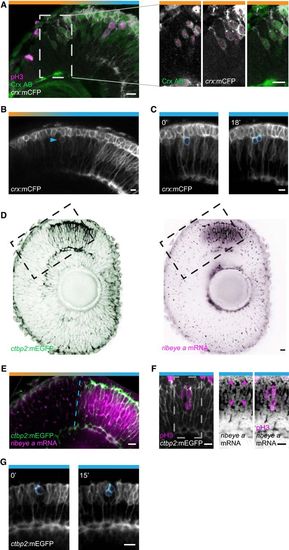
BC progenitors dividing in the laminated retina express Crx and ribeye a A. Confocal image of a cryostat section of a 2 dpf crx:mCFP retina immunostained with antibodies against Crx and pH3. Co‐labeled cells are indicated by magenta dots. Scale bars: 10 μm.B. In vivo image of a 2 dpf crx:mCFP retina. Expression of mCFP in the INL is largely limited to the “laminated” region (cyan bar above the figure panel) of the retina while only photoreceptors are labeled in the unlaminated parts of the retina (orange bar above panel). One crx:mCFP+ progenitor (cyan arrowhead) can be seen in an early stage of division, which judged by transgene expression levels, belongs to the most differentiated cells in this intermediate part of the INL. Scale bar: 10 μm.C. In vivo time‐lapse images of a crx:mCFP+ progenitor undergoing mitotic division (pseudo‐colored cyan) in the INL of a 2 dpf embryo. Ninety‐seven such divisions were observed in four time‐lapse recordings of a total of 32.1 h. Scale bar: 10 μm.D. Contrast inverted confocal images of an eye from a 2 dpf ctbp2:mEGFP transgenic fish immunostained to visualize GFP (left panel) and processed for fluorescence in situ hybridization to detect expression of a ribeye a specific exon (right panel). Scale bar: 10 μm.E. High magnification of boxed area in (D). Expression of the ctbp2:mEGFP transgene and endogenous ribeye a mRNA is restricted to the INL in the laminated region of the retina (cyan bar over figure panel). Dashed line indicates onset of expression. Scale bar: 10 μm.F. Confocal images of a 2 dpf ctbp2:mEGFP retina labeled to detect GFP, pH3, and ribeye a mRNA. A ribeye a+ pH3+ non‐apically dividing progenitor (magenta arrowheads, middle panel) can be seen in a laminated region of the retina (cyan bars above panels). Scale bar: 10 μm.G. ctbp2:mEGFP+ progenitor cell undergoing mitotic division (pseudo‐colored cyan) in the INL during an in vivo time‐lapse recording of a 2 dpf retina. Eighty‐seven such divisions were observed in two time‐lapse recordings totaling 32.8 h. Scale bar: 10 μm. |
Expression Data
Expression Detail
Antibody Labeling
Phenotype Data
Phenotype Detail
Acknowledgments
This image is the copyrighted work of the attributed author or publisher, and
ZFIN has permission only to display this image to its users.
Additional permissions should be obtained from the applicable author or publisher of the image.
Full text @ EMBO J.