
Fig. 4
- ID
- ZDB-FIG-170508-18
- Publication
- Sahu et al., 2017 - Calcium signals drive cell shape changes during zebrafish midbrain-hindbrain boundary formation
- Other Figures
- All Figure Page
- Back to All Figure Page
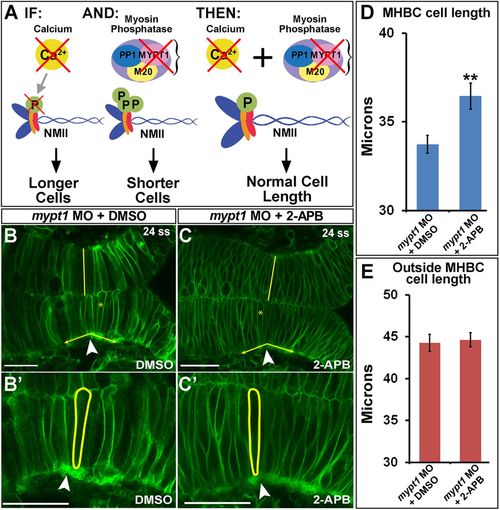
Calcium inhibition rescues NMII overactivation at the MHBC. (A) Hypothesized role of Ca2+ and NMII interactions. IF, inhibition of Ca2+ by 2-APB results in longer MHBC cells; AND, mypt1 knockdown results in overactivation of MRLC, causing shorter and wider MHB cells; THEN, inhibition of Ca2+ in mypt1-knockdown embryos would rescue MHBC cell length. (B, C) Confocal images of 24-ss embryos coinjected with mGFP and mypt1 MO and treated with (B) DMSO or (C) 2-APB. (B′, C′) Magnified images from B and C. Arrowheads indicate MHBC. (D, E) Cell length quantification at the MHBC and 40 μm outside the MHBC. For statistical analysis, the Mann–Whitney U test was done. **p < 0.01, mean ± SEM. For each measurement, mypt1 MO plus DMSO (n = 11; 22 cells) and mypt1 MO plus 2-APB (n = 13; 26 cells). Scale bars, 25 μm. |
| Fish: | |
|---|---|
| Condition: | |
| Knockdown Reagent: | |
| Observed In: | |
| Stage: | 20-25 somites |