
Fig. 2
- ID
- ZDB-FIG-170508-16
- Publication
- Sahu et al., 2017 - Calcium signals drive cell shape changes during zebrafish midbrain-hindbrain boundary formation
- Other Figures
- All Figure Page
- Back to All Figure Page
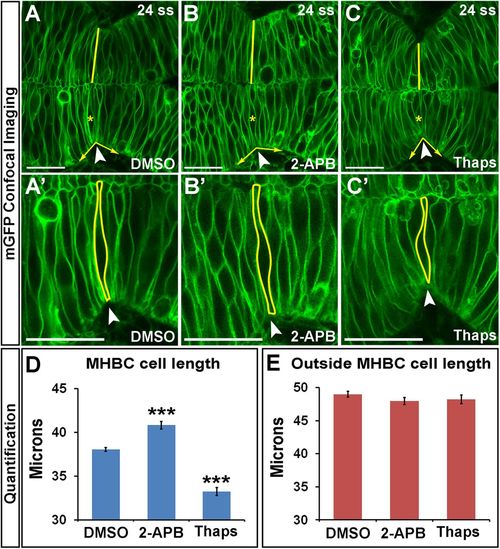
Calcium regulates cell length at the MHBC. (A–C′) Confocal images of embryos injected with mGFP and treated at 18 ss with (A, A′) DMSO, (B, B′) 100 μM 2-APB, or (C, C′) 2 μM Thaps. Embryos were washed, incubated, and live imaged at 24 ss. (A′–C′) Magnifications of A–C. Arrowheads indicate the MHBC. Asterisks in A–C indicate cell outlined in A′–C′. (D, E) Cell length quantification at the MHBC and 40 μm outside the MHBC. For statistical analysis, one-way ANOVA with Tukey’s HSD post hoc test was done. ***p < 0.001 compared with DMSO, mean ± SEM. For each measurement, DMSO (n = 29; 58 cells), 2-APB (n = 16; 32 cells), and Thaps (n = 14; 28 cells). Scale bars, 25 μm. |
| Fish: | |
|---|---|
| Conditions: | |
| Observed In: | |
| Stage: | 20-25 somites |