
- Title
-
Calcium signals drive cell shape changes during zebrafish midbrain-hindbrain boundary formation
- Authors
- Sahu, S.U., Visetsouk, M.R., Garde, R.J., Hennes, L., Kwas, C., Gutzman, J.H.
- Source
- Full text @ Mol. Biol. Cell
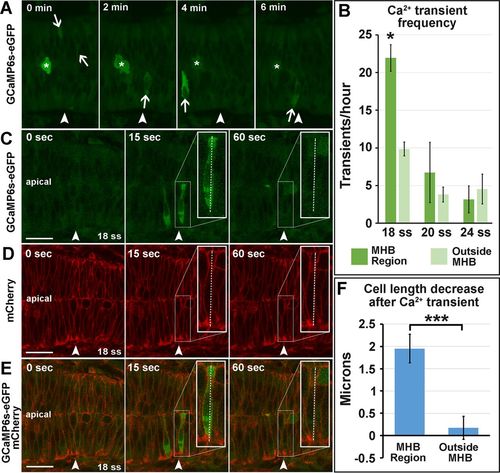
Calcium transients are enriched in the MHB at 18 ss and precede decreases in cell length. (A) Representative wild-type 18 ss time-lapse images of intracellular Ca2+ transients (panels from Supplemental Movie S1). Asterisks indicate mitotic cells, and arrows indicate Ca2+ transients analyzed. (B) Quantification of Ca2+ transients at 18, 20, and 24 ss. (C–E) Representative wild-type images at 18 ss analyzed for cell length changes after Ca2+ transients. (F) Quantification indicating the amount of decrease in cell length immediately after Ca2+ transients. For statistical analysis, one-way ANOVA with Tukey’s HSD post hoc test was conducted for Ca2+ transient frequency. *p < 0.05, mean ± SEM. Embryos analyzed: 18 ss, n = 11; 20 ss, n = 10; 24 ss, n = 8. Mann–Whitney U test was performed for analysis of cell length decrease after Ca2+ transients. ***p < 0.001, mean ± SEM. Embryos analyzed, n = 10; MHB region cells, 17; outside MHB cells, 6. Arrowheads indicate the MHBC. Scale bars, 25 μm. |
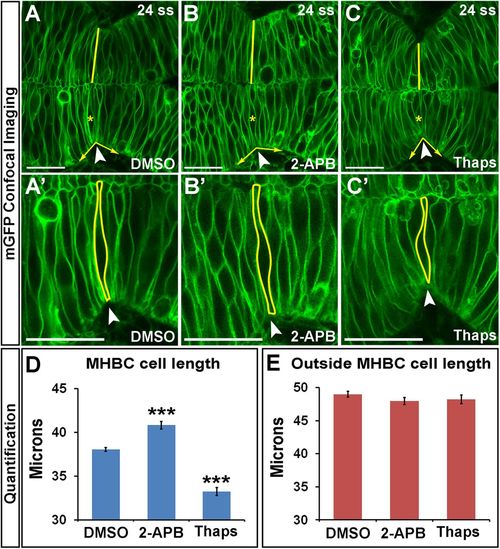
Calcium regulates cell length at the MHBC. (A–C′) Confocal images of embryos injected with mGFP and treated at 18 ss with (A, A′) DMSO, (B, B′) 100 μM 2-APB, or (C, C′) 2 μM Thaps. Embryos were washed, incubated, and live imaged at 24 ss. (A′–C′) Magnifications of A–C. Arrowheads indicate the MHBC. Asterisks in A–C indicate cell outlined in A′–C′. (D, E) Cell length quantification at the MHBC and 40 μm outside the MHBC. For statistical analysis, one-way ANOVA with Tukey’s HSD post hoc test was done. ***p < 0.001 compared with DMSO, mean ± SEM. For each measurement, DMSO (n = 29; 58 cells), 2-APB (n = 16; 32 cells), and Thaps (n = 14; 28 cells). Scale bars, 25 μm. |
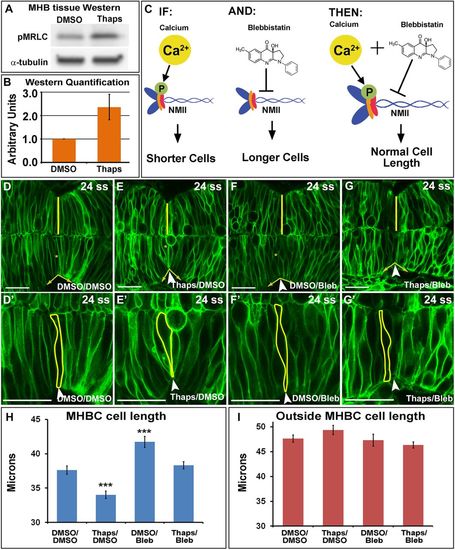
Calcium signals to NMII at the MHB to modulate MHBC cell length. (A) Representative Western blot for pMRLC in MHB-specific tissue dissected after DMSO or 2 μM Thaps treatment. (B) pMRLC Western quantification using α-tubulin as a control (n = 4). (C) Hypothesized role of Ca2+ and NMII interactions. IF, increase in Ca2+ leads to increased pMRLC to activate NMII and causes shorter cells at the MHBC; AND, Bleb inhibits NMII function; THEN, Thaps treatment to increase Ca2+ leading to shorter cells can be rescued with NMII inhibition by Bleb. (D–G′) Confocal images of mGFP-injected embryos treated with (D, D′) DMSO/DMSO, (E, E′) Thaps/DMSO, (F, F′) DMSO/Bleb, or (G, G′) Thaps/Bleb. (D′–G′) Magnifications of D–G. Arrowheads indicate the MHBC. Asterisks in D–G indicate cell outlined in D′–G′. (H, I) Cell length quantification at the MHBC and 40 μm outside the MHBC. For statistical analysis, one-way ANOVA with Tukey’s HSD post hoc test was done. ***p < 0.001 compared with DMSO/DMSO; mean ± SEM. For each measurement, DMSO/DMSO (n = 9; 18 cells), Thaps/DMSO (n = 9; 18 cells), DMSO/Bleb (n = 7; 14 cells), and Thaps/Bleb (n = 8; 16 cells). Scale bars, 25 μm. EXPRESSION / LABELING:
PHENOTYPE:
|
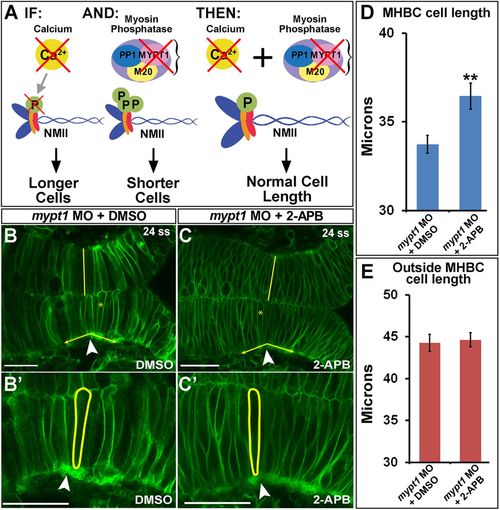
Calcium inhibition rescues NMII overactivation at the MHBC. (A) Hypothesized role of Ca2+ and NMII interactions. IF, inhibition of Ca2+ by 2-APB results in longer MHBC cells; AND, mypt1 knockdown results in overactivation of MRLC, causing shorter and wider MHB cells; THEN, inhibition of Ca2+ in mypt1-knockdown embryos would rescue MHBC cell length. (B, C) Confocal images of 24-ss embryos coinjected with mGFP and mypt1 MO and treated with (B) DMSO or (C) 2-APB. (B′, C′) Magnified images from B and C. Arrowheads indicate MHBC. (D, E) Cell length quantification at the MHBC and 40 μm outside the MHBC. For statistical analysis, the Mann–Whitney U test was done. **p < 0.01, mean ± SEM. For each measurement, mypt1 MO plus DMSO (n = 11; 22 cells) and mypt1 MO plus 2-APB (n = 13; 26 cells). Scale bars, 25 μm. PHENOTYPE:
|
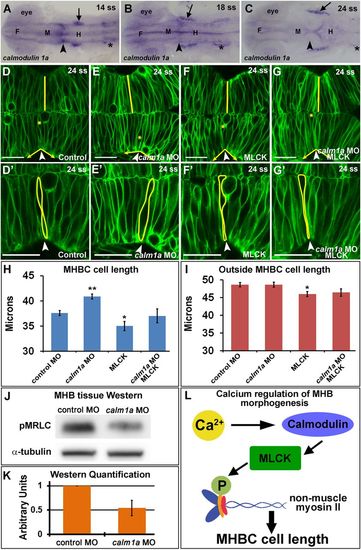
Calmodulin 1a and MLCK mediate cell length at the MHBC. (A–C) calm1a gene expression by in situ hybridization. Arrowheads indicate MHBC, and arrows indicate trigeminal ganglia; asterisks indicate otic vesicle. F, forebrain; M, midbrain; H, hindbrain. (D–G′) Confocal images of embryos injected with mGFP and (D, D′) control MO, (E, E′) calm1a MO, (F, F′) MLCK mRNA, or (G, G′) calm1a MO and MLCK mRNA. (D′–G′) Magnification of D–G. Arrowheads indicate the MHBC. Asterisks in D–G indicate cell outlined in D′–G′. (H, I) Cell length quantification at the MHBC and 40 μm outside the MHBC. (J) Representative Western blots for pMRLC in MHB-specific tissue dissected after control MO or calm1a MO injection. (K) pMRLC Western quantification using α-tubulin as a control (n = 5). (L) Proposed signaling pathway for Ca2+ regulation of cell length at the MHBC. For statistical analysis, one-way ANOVA with Tukey’s HSD post hoc test was done. **p < 0.01 and *p < 0.05 compared with control, mean ± SEM. Control MO (n = 17; 34 cells), calm1a MO (n = 19; 38 cells), MLCK mRNA (n = 13; 26 cells), and calm1a MO plus MLCK (n = 9; 18 cells). Scale bars, 25 μm. EXPRESSION / LABELING:
PHENOTYPE:
|