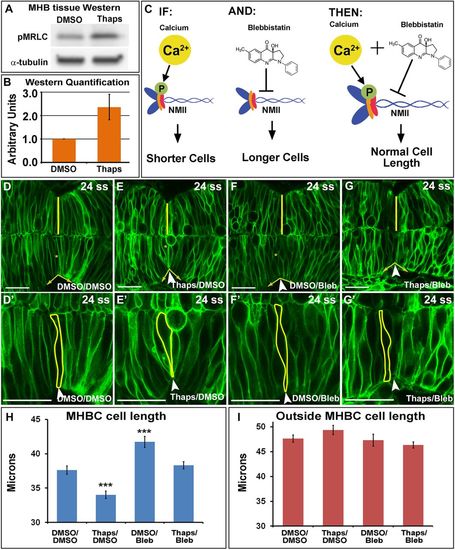
Calcium signals to NMII at the MHB to modulate MHBC cell length. (A) Representative Western blot for pMRLC in MHB-specific tissue dissected after DMSO or 2 μM Thaps treatment. (B) pMRLC Western quantification using α-tubulin as a control (n = 4). (C) Hypothesized role of Ca2+ and NMII interactions. IF, increase in Ca2+ leads to increased pMRLC to activate NMII and causes shorter cells at the MHBC; AND, Bleb inhibits NMII function; THEN, Thaps treatment to increase Ca2+ leading to shorter cells can be rescued with NMII inhibition by Bleb. (D–G′) Confocal images of mGFP-injected embryos treated with (D, D′) DMSO/DMSO, (E, E′) Thaps/DMSO, (F, F′) DMSO/Bleb, or (G, G′) Thaps/Bleb. (D′–G′) Magnifications of D–G. Arrowheads indicate the MHBC. Asterisks in D–G indicate cell outlined in D′–G′. (H, I) Cell length quantification at the MHBC and 40 μm outside the MHBC. For statistical analysis, one-way ANOVA with Tukey’s HSD post hoc test was done. ***p < 0.001 compared with DMSO/DMSO; mean ± SEM. For each measurement, DMSO/DMSO (n = 9; 18 cells), Thaps/DMSO (n = 9; 18 cells), DMSO/Bleb (n = 7; 14 cells), and Thaps/Bleb (n = 8; 16 cells). Scale bars, 25 μm.
|
