
Fig. 1
- ID
- ZDB-FIG-170508-15
- Publication
- Sahu et al., 2017 - Calcium signals drive cell shape changes during zebrafish midbrain-hindbrain boundary formation
- Other Figures
- All Figure Page
- Back to All Figure Page
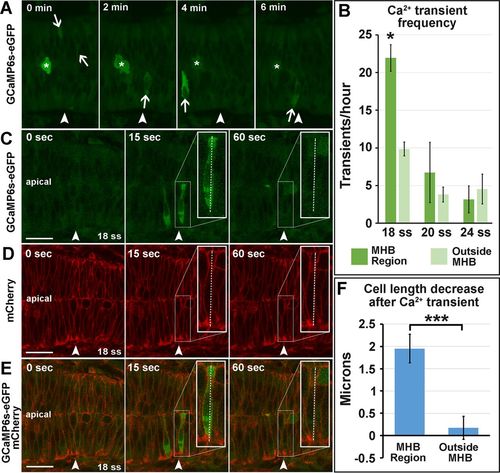
Calcium transients are enriched in the MHB at 18 ss and precede decreases in cell length. (A) Representative wild-type 18 ss time-lapse images of intracellular Ca2+ transients (panels from Supplemental Movie S1). Asterisks indicate mitotic cells, and arrows indicate Ca2+ transients analyzed. (B) Quantification of Ca2+ transients at 18, 20, and 24 ss. (C–E) Representative wild-type images at 18 ss analyzed for cell length changes after Ca2+ transients. (F) Quantification indicating the amount of decrease in cell length immediately after Ca2+ transients. For statistical analysis, one-way ANOVA with Tukey’s HSD post hoc test was conducted for Ca2+ transient frequency. *p < 0.05, mean ± SEM. Embryos analyzed: 18 ss, n = 11; 20 ss, n = 10; 24 ss, n = 8. Mann–Whitney U test was performed for analysis of cell length decrease after Ca2+ transients. ***p < 0.001, mean ± SEM. Embryos analyzed, n = 10; MHB region cells, 17; outside MHB cells, 6. Arrowheads indicate the MHBC. Scale bars, 25 μm. |