
Fig. 5
- ID
- ZDB-FIG-160727-5
- Publication
- Liao et al., 2016 - Faster embryonic segmentation through elevated Delta-Notch signalling
- Other Figures
- All Figure Page
- Back to All Figure Page
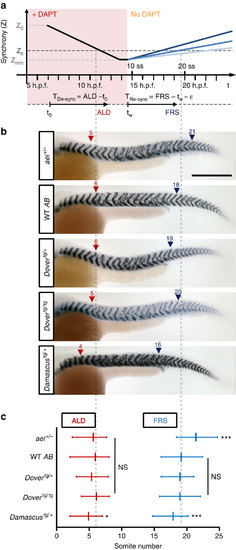
Elevated DeltaD increases the strength of coupling in the segmentation clock. (a) Schematic of DAPT pulse-chase synchrony rescue assay for estimating relative coupling strength. Presumptive synchrony level (Z) versus experimental time scale shown in upper panel. Z is an order parameter that measures the degree of synchrony between neighbouring oscillators, with 1 indicating perfect synchrony and 0 indicating complete lack of temporal correlation, as defined in ref. 11. Z0, initial synchrony level at shield stage (6 h.p.f.); Zc, critical level of synchrony for forming non-defective segment boundaries; Zmin, putative minimal synchrony at de-synchronized state; darkness of blue lines depict relative coupling strength. Time intervals (TRe-sync) between DAPT wash-out and resynchronized states reflect coupling strength (µ). (b) Segment boundaries after DAPT pulse-chase in mutant and transgenic backgrounds. Numbers above arrowheads indicate the values of ALD (red triangle) or FRS (blue triangle). Scale bar, 300 µm. (c) Quantification of DAPT pulse-chase experiments. ALD (red) and FRS (blue) from left or right side independently, as shown in a. Data from aei+/- (n=48), WT (n=94), Dovertg/+ (n=43), Dovertg/tg (n=36) and Damascustg/+ (n=78) pooled from three independent trials. Data is mean value with error bars showing 5th and 95th percentiles. *P≤0.05, ***P≤0.001, NS, not significant (P>0.05), Student’s t-test. |