
Fig. 3
- ID
- ZDB-FIG-160727-3
- Publication
- Liao et al., 2016 - Faster embryonic segmentation through elevated Delta-Notch signalling
- Other Figures
- All Figure Page
- Back to All Figure Page
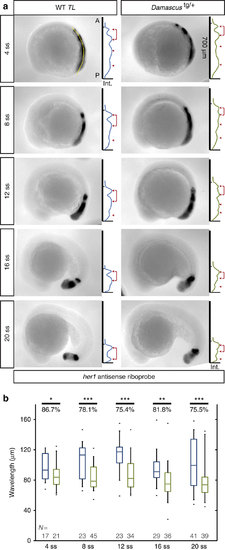
Damascus has shorter anterior wavelength. (a) Measurement of her1 anterior wavelength from 4 to 20 somite-stage. In each representative embryo panel, left part: examples of WT TL or Damascustg/+ embryos in lateral view, anterior to left, after ISH with her1 probe. The line of interest for image processing is visible in yellow, extending from the tip of the tail bud to the somites. Right part: (inverted) gene expression signal intensity (x axis) versus position along the anterior-posterior axis (y axis) plots for the embryos in the left-hand part. The tick marker on the y axis indicates the X0 position, and y axis is the scale bar (700µm) to its representative embryo as well. Peak maxima is indicated with red triangles. The anterior wavelength, defined as the distance between the most anterior two gene expression maxima, is indicated by a red bracket. A, anterior; Int., intensity in arbitrary unit; P, posterior. (b) The most anterior wavelength of her1 mRNA gene expression pattern. The average ratio (in percentage) between WT TL or Damascustg/+ embryos for each stage examined are labelled above the plots. Blue, WT; Green, Damascustg/+. The central boxes of box-and-whisker plots cover the interquartile range with median as line within box. Whiskers are 5th and 95th percentiles, extreme values are grey bars. *P≤0.05, **P≤0.01, ***P≤0.001, Student’s t-test. |