
Fig. 1
- ID
- ZDB-FIG-160727-1
- Publication
- Liao et al., 2016 - Faster embryonic segmentation through elevated Delta-Notch signalling
- Other Figures
- All Figure Page
- Back to All Figure Page
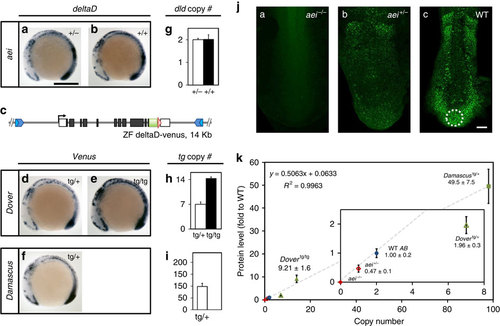
A range of transgenic lines with elevated spatiotemporally accurate DeltaD expression. (a-f) deltaD-venus recapitulates WT deltaD expression pattern. Whole-mount ISH, 9 somite-stage embryos lateral view with either deltaD or egfp anti-sense riboprobe in deltaD mutant after eight (aei)+/- (a), WT AB (b) or deltaD-venus transgenic lines (d-f). (c) Schematic representation of deltaD-venus construct for generating transgenic lines. See Supplementary Fig. 1. (a) Scale bar, 300µm. (f-h) deltaD transgenic copy numbers determined by quantitative real-time PCR from genomic DNA. Copy number is insensitive to aei point mutation allele (g). Transgenic copies (h,i) are total deltaD copies minus 2 endogenous copies. Empty bars, heterozygous genotypes; black bars, homozygous genotypes. Data pooled from ≥3 independent experiments, mean±s.d. (j) DeltaD protein expression visualized and quantitated by immunostaining. (ja-jc) PSM of flat-mounted 9 somite-stage embryos, circle shows region used for intensity measurement. Scale bar, 50µm. (k) DeltaD protein expression levels versus deltaD gene copy number. Expression level in aei-/- was defined as 0. Grey dashed line, linear fit as the formula and R2 value at upper left corner. Inset shows magnification of data points at origin. Mean±s.d. (n≥5). |