
- Title
-
Faster embryonic segmentation through elevated Delta-Notch signalling
- Authors
- Liao, B.K., Jörg, D.J., Oates, A.C.
- Source
- Full text @ Nat. Commun.
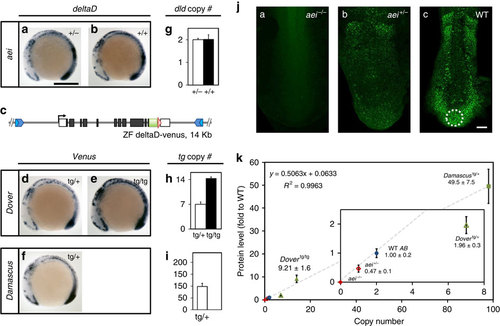
A range of transgenic lines with elevated spatiotemporally accurate DeltaD expression. (a-f) deltaD-venus recapitulates WT deltaD expression pattern. Whole-mount ISH, 9 somite-stage embryos lateral view with either deltaD or egfp anti-sense riboprobe in deltaD mutant after eight (aei)+/- (a), WT AB (b) or deltaD-venus transgenic lines (d-f). (c) Schematic representation of deltaD-venus construct for generating transgenic lines. See Supplementary Fig. 1. (a) Scale bar, 300µm. (f-h) deltaD transgenic copy numbers determined by quantitative real-time PCR from genomic DNA. Copy number is insensitive to aei point mutation allele (g). Transgenic copies (h,i) are total deltaD copies minus 2 endogenous copies. Empty bars, heterozygous genotypes; black bars, homozygous genotypes. Data pooled from ≥3 independent experiments, mean±s.d. (j) DeltaD protein expression visualized and quantitated by immunostaining. (ja-jc) PSM of flat-mounted 9 somite-stage embryos, circle shows region used for intensity measurement. Scale bar, 50µm. (k) DeltaD protein expression levels versus deltaD gene copy number. Expression level in aei-/- was defined as 0. Grey dashed line, linear fit as the formula and R2 value at upper left corner. Inset shows magnification of data points at origin. Mean±s.d. (n≥5). |
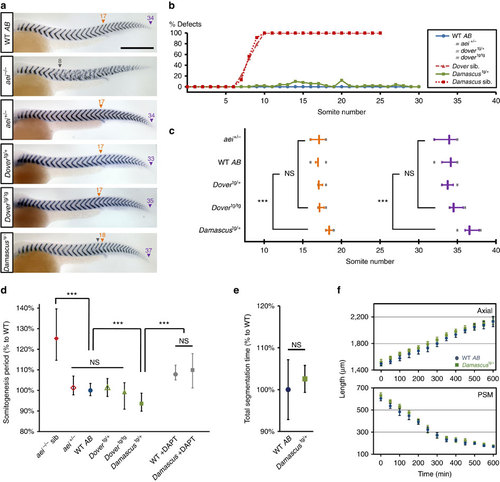
Elevated DeltaD speeds somitogenesis. (a) Representative embryos at 36 h post fertilization (h.p.f.) stained with segment boundary marker cb1045 (xirp2a). Rescue of segmentation defects in aei-/- genotype background by dover and damascus. Numbers above arrowheads indicate the posterior boundaries of the corresponding ordinal segments. Orange triangle, segment boundary aligned with proctodeum; purple triangle, last segment boundary observed; grey triangle, defective segment boundaries or onset of defects. Scale bar=300 µm. (b) Distribution of somite defects showing deltaD-venus rescues aei-/- throughout somitogenesis. No defective boundaries observed in WT AB (n=74), aei+/- (n=76), Dovertg/+ (n=95) and Dovertg/tg (n=60) (blue line). Damascus showed low penetrance of defects (2.6% from the 1st to 30th segments, n=64) (green line). aei-/- siblings (sib) of dover (n=29) or Damascus (n=33) showed typical deltaD lost-of-function phenotypes, mean ALD around eight (red lines). (c) Damascus has more segments and shifted segmental position of proctodeum. Quantification from embryos as shown in a. Orange, level of proctodeum; magenta, total segment number; grey bars, extreme values. (d) Somitogenesis period of trunk region (s4-s19) measured at 28.3±0.3 °C by multiple embryo time-lapse imaging. Mean periods normalized to WT AB. Data pooled from ≥ 3 independent trials (n≥ 12 embryos for each condition), except aei-/- siblings from 1 trial (n=6). (e) Total segmentation time is the interval between the 4th segment to the last segment observed in time-lapse movies. Quantification of corresponding movies described in b. Data pooled from ≥ 3 independent trials (n≥ 12 embryos for each condition). Mean durations normalized to WT AB (f) Axis elongation and PSM shortening are not altered in Damascus. Data analyzed from same time-lapse movies as d. Time 0 is defined at 5 ss. **P≤0.001, NS, not significant (P>0.05), Student’s t-test. Error bars show the 5th and 95th percentiles of the data. |
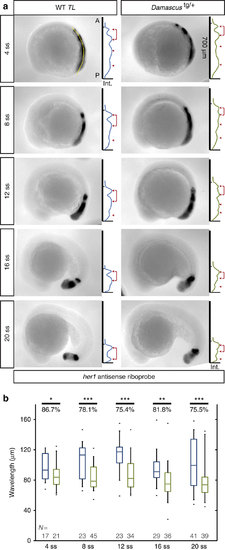
Damascus has shorter anterior wavelength. (a) Measurement of her1 anterior wavelength from 4 to 20 somite-stage. In each representative embryo panel, left part: examples of WT TL or Damascustg/+ embryos in lateral view, anterior to left, after ISH with her1 probe. The line of interest for image processing is visible in yellow, extending from the tip of the tail bud to the somites. Right part: (inverted) gene expression signal intensity (x axis) versus position along the anterior-posterior axis (y axis) plots for the embryos in the left-hand part. The tick marker on the y axis indicates the X0 position, and y axis is the scale bar (700µm) to its representative embryo as well. Peak maxima is indicated with red triangles. The anterior wavelength, defined as the distance between the most anterior two gene expression maxima, is indicated by a red bracket. A, anterior; Int., intensity in arbitrary unit; P, posterior. (b) The most anterior wavelength of her1 mRNA gene expression pattern. The average ratio (in percentage) between WT TL or Damascustg/+ embryos for each stage examined are labelled above the plots. Blue, WT; Green, Damascustg/+. The central boxes of box-and-whisker plots cover the interquartile range with median as line within box. Whiskers are 5th and 95th percentiles, extreme values are grey bars. *P≤0.05, **P≤0.01, ***P≤0.001, Student’s t-test. |

Elevated DeltaD increases the strength of lateral inhibition in the CNS. (a-f) Representative embryos stained with islet1, an early marker of primary neuronal differentiation. In each box, 4 somite-stage embryos lateral view, anterior to left (upper panel); dorsal view with anterior to top (lower left panel), of head showing bilateral trigeminal ganglia (TG); mid-trunk showing PMN at the midline, and RB neurons at lateral margin of neural plate (lower right panel). (a) Scale bars, 250µm. (g) Cell density of PMN. (h) Cell density of RB sensory neurons. (i) Area of the TG. Lower densities or smaller areas indicate higher Notch signalling strength. Data from aei-/- (n=33), aei+/- (n=18), WT (n=35), Dovertg/+ (n=14), Dovertg/tg (n=12) and Damascustg/+ (n≥2 independent trials. The central boxes of the box-and-whisker plots cover the interquartile range with median as line within box. Whiskers are 5th and 95th percentiles, extreme values are small bars. *P≤0.05, **P≤0.01, ***P≤0.001, NS, not significant (P>0.05), Student’s t-test. |
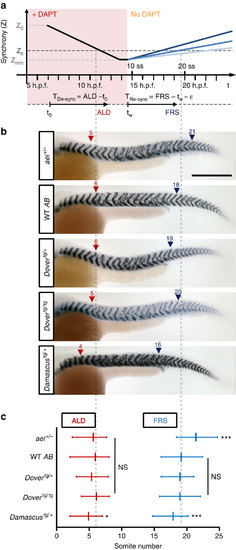
Elevated DeltaD increases the strength of coupling in the segmentation clock. (a) Schematic of DAPT pulse-chase synchrony rescue assay for estimating relative coupling strength. Presumptive synchrony level (Z) versus experimental time scale shown in upper panel. Z is an order parameter that measures the degree of synchrony between neighbouring oscillators, with 1 indicating perfect synchrony and 0 indicating complete lack of temporal correlation, as defined in ref. 11. Z0, initial synchrony level at shield stage (6 h.p.f.); Zc, critical level of synchrony for forming non-defective segment boundaries; Zmin, putative minimal synchrony at de-synchronized state; darkness of blue lines depict relative coupling strength. Time intervals (TRe-sync) between DAPT wash-out and resynchronized states reflect coupling strength (µ). (b) Segment boundaries after DAPT pulse-chase in mutant and transgenic backgrounds. Numbers above arrowheads indicate the values of ALD (red triangle) or FRS (blue triangle). Scale bar, 300 µm. (c) Quantification of DAPT pulse-chase experiments. ALD (red) and FRS (blue) from left or right side independently, as shown in a. Data from aei+/- (n=48), WT (n=94), Dovertg/+ (n=43), Dovertg/tg (n=36) and Damascustg/+ (n=78) pooled from three independent trials. Data is mean value with error bars showing 5th and 95th percentiles. *P≤0.05, ***P≤0.001, NS, not significant (P>0.05), Student’s t-test. |