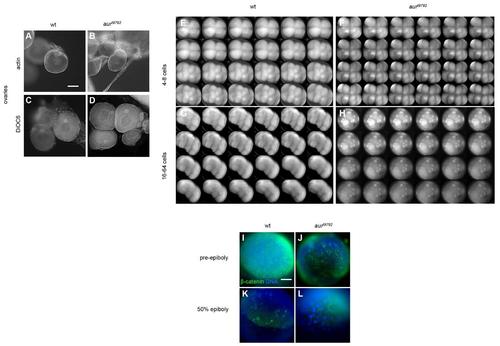
Overview of landmarks of oogenesis and early cleavage in aura mutants. (A-D) Landmarks during oogenesis appear normal in aura oocytes. (A,B) Accumulation of F-actin appears unaffected normal in stage I aura mutant oocytes (wt= 5/5, aura= 4/4). Accumulation and localization of mitochondria and ER, marking the Balbiani body (Gupta et al. 2010), appears normal in stage I aura mutant oocytes (wt= 23/23, aura= 20/20). (E-H) Loss of blastomere cellular adhesion in aura mutant embryos. Live imaging of F-actin in embryos using the Life Act transgene in wild-type (3/3 E,G) and aura mutant line (3/3 F,H). The cellular pattern is relatively normal up to the 8-cell stage, as expected since cell adhesion is a property of mature furrows that become fully formed for the first cell cycle at this stage. By late 16-cell stage, aura embryos begin to display rounded and loose cells, which can be of varying sizes, consistent with defects in late cytokinesis involving reduced adhesive membrane deposition and membrane regression. The normal cleavage pattern up to the 8-cell stage indicates that the spindle orientation that results in the typically invariant cleavage pattern is normal. Images were taken in one minute intervals from 60 mpf to 85 mpf (E,F) and two minute intervals from 90 mpf to 120 mpf (G,H). (I-L) In aura mutants, DNA masses undergo epiboly-like vegetal movement in the absence of cellular layers. The DNA masses are uneven, likely due to the lack of cell membranes in these embryos and consequent mis-segregation of chromosomes by neighboring asters. Top panels (I,J, animal view) are pre-epiboly stages (4 hpf), bottom panels (K,L, side view) are 50% epiboly stages (5.5 hpf). DNA masses in aura mutants (J,L) appear at vegetal levels consistent with an epibolic-like movement, similar to migration in wild-type (I,K) except with reduced cell membrane formation. β-catenin (green, highlights membrane, which is reduced in mutants), DNA (blue). Scale bars: A-D: 25 µm; I-L: 100 µm
|
