
Fig. 8
- ID
- ZDB-FIG-160311-23
- Publication
- Guo et al., 2016 - Functional Investigation of a Non-coding Variant Associated with Adolescent Idiopathic Scoliosis in Zebrafish: Elevated Expression of the Ladybird Homeobox Gene Causes Body Axis Deformation
- Other Figures
- All Figure Page
- Back to All Figure Page
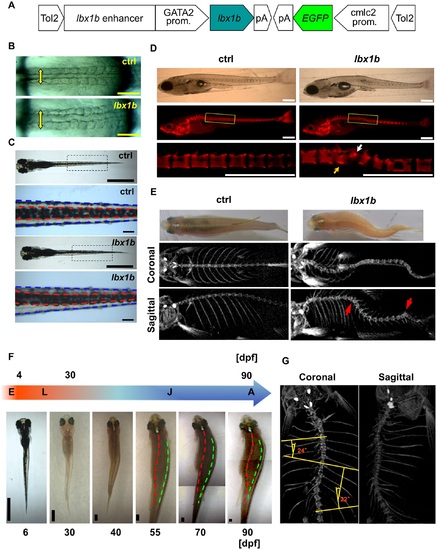
Scoliosis in transgenic founder zebrafish expressing lbx1b using the GATA2 minimal promoter and the lbx1b enhancer. (A) The transgene construct is shown. The GATA2 minimal promoter and lbx1b enhancer cooperatively drive lbx1b expression. (B) Dorsal views of live GATA2-1b:MCS (ctrl) or GATA2-1b:lbx1b (lbx1b) injected embryos with 10–13 somites. Somite arrangement is bilateral and symmetric in control embryos, but asymmetrical in lbx1b embryos. The yellow arrows indicate the mediolateral length of somites. (C) Dorsal views of 6 dpf larvae. The red and blue dotted lines indicate the boundaries of the dorsal melanophore stripes and the trunk, respectively. A displaced dorsal melanophore stripe was observed in lbx1b larvae. (D) Lateral views of alizarin red-stained larvae at 21 dpf. The white and yellow arrows indicate the hemivertebrae and block vertebra that developed from the deformed notochord in lbx1b larva, respectively. (E) Dorsal views and micro-computed tomography (µCT) analysis of adult zebrafish. Scoliosis was observed in adult fish grown from embryos with mild notochord deformities. The coronal and sagittal planes are reconstructed from µCT images of the fish in the upper panels, each showing a gross appearance. The red arrows indicate vertebral malformation. (F) Diagram of zebrafish growth stages. Continuous observation of one GATA2-1b:lbx1b-injected larva with a displaced dorsal melanophore stripe, but without notochord deformation, from 6 to 90 dpf. The red and green dotted lines indicate the dorsal middle lines and the right upper boundary of the lateral stripe, respectively. Progressive scoliosis with rotation of the longitudinal axis of the body was observed after 55 dpf. E, embryo; L, larva; J, juvenile; A, adult. (G) µCT analysis of the three-dimensional structure of the spine of the same zebrafish in (F) showing scoliosis. Cobb’s angle was measured in the coronal plane. Scale bars in (B): 200 µm; (C): 1 mm or 100 µm; (D): 500 µm; and (F): 1 mm. |
| Fish: | |
|---|---|
| Observed In: | |
| Stage Range: | Day 6 to Adult |