
Fig. S12
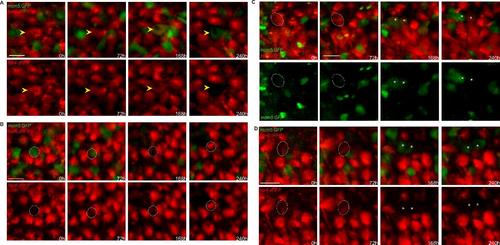
Fluctuations of her4:drfp expression preceding or following NSC division. High magnification (dorsal views) of groups of cells in a her4:dRFP;mcm5:eGFP;casper transgenic fish (individual fish named piwi) filmed live through the skin and skull over 4 time points (t1-t4) spanning 10 days. Top panels: merged channels, bottom panels: red or green channels only. (A) Example of a RG about to divide and switching off her4:drfp expression after turning on mcm5:egfp. (B) Example of a mcm5:gfp-positive cell acquiring her4:drfp expression, likely after division. (C) Additional example of an asymmetric, gliogenic (selfrenewing) division. The circle is showing a RG cell expressing RFP only on the first days, switching on mcm5:egfp and dividing at t3 and giving rise to two daughter cells (asterisks) one of which expresses RFP only (and harboring a process, not shown) (right cell) and the other maintaining GFP only (left cell). (D) Example of a symmetric division where both daughters harbor a non-glial fate at time t4. The circle surrounds the initial RG, and asterisk indicate the position of the two daughters. Scale bars: 20 µm (A-D). |