
Fig. 5
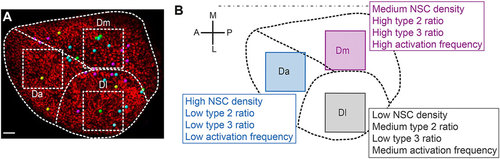
Schematic summary of the distinct NSC parameters observed across the pallial germinal zone. (A) Spatial distribution of the different types of division events completed over the imaging period (Table S2, cases 6 to 9) among 1138 tracked cells (from Fig. 4, Fig. S12). Yellow dots, symmetric gliogenic symmetric divisions; cyan dots, asymmetric gliogenic generating a RG and a ‘lost’ cell at t4; magenta dots, asymmetric gliogenic generating a RG and a proliferating progenitor at t4; green dots, symmetric with an undetermined fate of both daughters. These correspond respectively to cases 6 to 9 in Table S2. (B) Cell density and activation frequency parameters mapped in Da, Dm and Dl (from Figs 2 and 3 and Fig. S11). In both panels, one hemisphere is shown, anterior to the left. Scale bar: 50µm. |