
Fig. 1
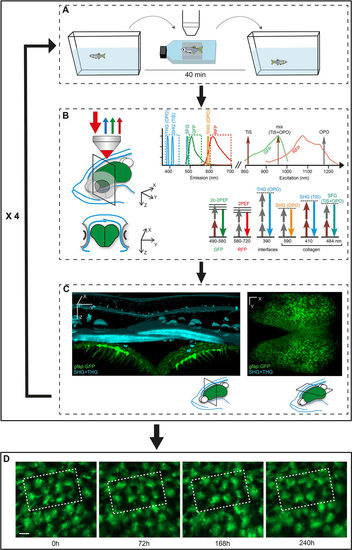
Workflow for the tracking of zebrafish pallial aNSCs in their endogenous niche over weeks. (A) The transparent double mutant fish line casper, crossed into fluorescent GFP and/or RFP backgrounds highlighting aNSCs and/or cell division events, is subjected to reiterated imaging at intervals of a few days over a period of weeks (see Fig. S2). The whole procedure (anesthesia, positioning and imaging) takes around 40min. (B) Combined multicolor fluorescence/harmonics multiphoton microscopy performed in vivo through the skin and skull (blue on the schematized fish head, left panel) down to the pallium (green) (top: lateral 3D view, bottom: cross section at the indicated plane) permits the concomitant recording of aNSCs (GFP, green arrows; RFP, red arrows) and skin/skull structures (SHG/THG harmonics, blue arrows). The combination of TiS and OPO laser excitation is schematized in the panel on the right, as well as the recorded signals (GFP, RFP, SHG, THG) and, when appropriate, the detected structure (e.g. collagen). (C) Harmonic signals revealing skin and skull morphology (blue on the 3D rendering of a thick optical cross section from an entire whole-mount imaging stack, left panel) are used to position the fish in an identical manner over the different imaging sessions. The aNSC layer (green, with processes extending into the brain parenchyma) is visible as a fluorescent signal underneath (left panel), or can be shown as a single whole-mount dorsal fluorescent recording (right panel). (D) The images recorded over consecutive sessions (repetitions of the sequence shown in A-C, e.g. here four times at a few days interval) are aligned using SHG/THG signals, followed by manual corrections using Imaris, to track individual cells over time. Dashed boxes outline the same group of cells recognizable over the consecutive time points. Scale bars: 50µm (C), 15µm (D). |