
Fig. S6
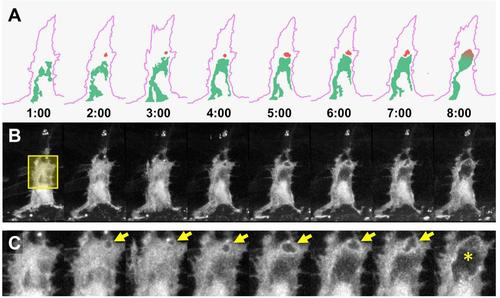
(A) Schematic diagrams illustrating the emergence and enlargement of an intracellular vacuole (red), and its eventual fusion with an extracellular nascent lumen (green) within an intersegmental vessel sprout (outlines in lavender). Elapsed time in minutes is noted. Diagrams correspond to the images below in panels (B) and (C). (B) Time series of green fluorescence confocal images (shown in grayscale) of an identified single (fli1a:H2B-TagBFP-p2A-eGFP-F) marked endothelial cell in a Tg(kdrl:mcherry-caax)y171 transgenic animal, showing emergence and enlargement of a vacuole and its eventual fusion with an an extracellular nascent lumen. The yellow box overlaid on the first timepoint image shows the region magnified in panel (C). (C) Higher magnification green fluorescence confocal close-up views (shown in grayscale) of the timeseries shown in panel B. Arrows note the position of the newly formed vacuole, while the asterisk marks the compartment into which the vacuole merges in the final image frome. See Supp. Movie 9 for an animation of the time series in panels B and C. |