
Fig. 6
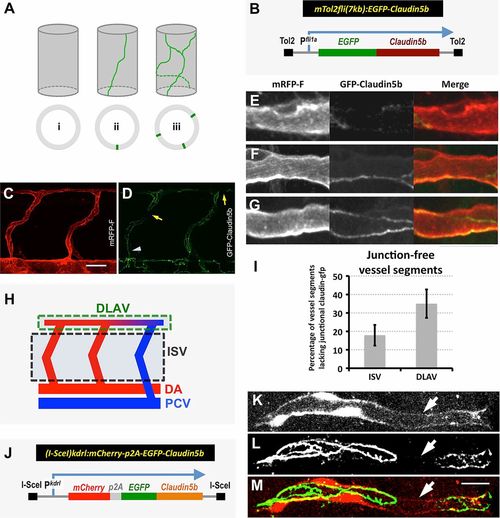
In vivo imaging of EC junctions. (A) Schematic depicting representative junctional morphologies observed in a unicellular endothelial ‘seamless’ tube lacking junctions along its length (i), a unicellular endothelial tube forming an autocellular junction (ii), and a multicellular endothelial tube with multiple intercellular junctions (iii). (B) Diagram of the Tg(fli1a:egfp-claudin 5b) Tol2 transgene construct used for generating a stable transgenic line marking endothelial junctions. (C,D) Confocal images of mid-trunk vessels in 42hpf Tg(fli1a:egfp-claudin 5b)y287; Tg(kdrl:mRFP-F)y286 double-transgenic embryos, showing eGFP-labeled endothelial tight junctions (D, green) in mRFP-positive ECs (C, red). Blood vessel segments with either no eGFP-Claudin 5b-labeled tight junction or a single line of eGFP-Claudin 5b-labeled tight junctions are highlighted by arrows or arrowhead, accordingly. (E-G) Higher magnification confocal micrographs of mid-trunk vessels in 48hpf Tg(fli1a:egfp-claudin 5b)y287; Tg(kdrl:mRFP-F) y286 double-transgenic embryos, showing vessel segments with a ‘gap’ in eGFP-Claudin 5b expression (E), with a single line of eGFP-Claudin 5b (F), and with multiple lines of eGFP-Claudin 5b (G). 3D rotations of the merged images in E-G are shown in supplementary material Movies 2-4. (H) Schematic of the trunk vascular network, showing ascending ISV and dorsal DLAV vascular segments that are quantified for the presence or absence of junctions (localized eGFP-Claudin 5b) in I. Arterial vessels (dorsal aorta, intersegmental arteries) are shown in red, venous vessels (posterior cardinal vein, intersegmental veins) are show in blue, and arterial-venous transition zones in the DLAV are denoted with a red-blue gradient. (I) Quantification of the percentage of vessel segments lacking localized eGFP-Claudin 5b expression in the ascending ISV segments or dorsal DLAV segments. (J) Diagram of the Tg(kdrl1:mcherry-p2A-egfp-claudin 5b) I-SceI kdrl transgene construct used for mosaic colabeling of EC membranes (mCherry) and cell-cell junctions (eGFP-Claudin 5b). (K-M) Higher magnification confocal micrographs of a 48hpf embryo injected with a Tol2(kdrl:mcherry-p2A-egfp-claudin 5b) transgene, showing mCherry (K), eGFP (L) and merged (M) fluorescence images. The mCherry-positive segment (K) has eGFP-Claudin 5b (L) localized to the ends but an eGFP-Claudin 5b-negative gap in the center of the segment (arrow). A 3D rotation of the merged image in M is shown in supplementary material Movie 5. All images are lateral views with rostral to the left. Scale bars: 20µm in C,D; 10µm in K-M. |