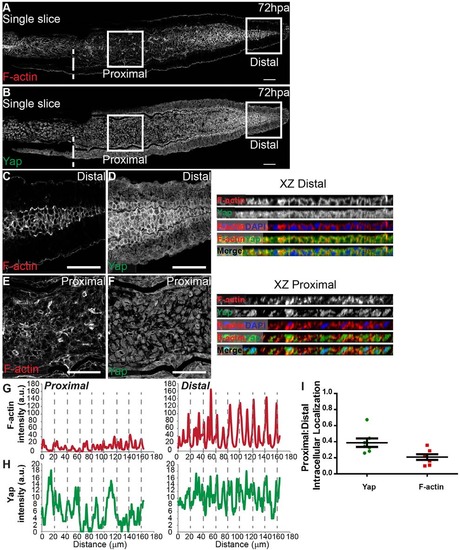
Differential PD expression of F-actin associates with Yap intracellular location. (A-F) Representative immunofluorescence with anti-Yap antibody and phalloidin (F-actin) in 72hpa longitudinal sections. (A) F-actin; (B) corresponding Yap expression. (C-F) High magnification images of the boxed areas in A,B showing F-actin (C,E) and Yap (D,F) localization in proximal (E,F) and distal (C,D) regions. Single color and merged xz projections of distal (C,D) and proximal (E,F) blastemas highlight intracellular localization. (G,H) Corresponding proximal and distal intensity profiles (in arbitrary units, a.u.) of xz projections represented showing average intensity of F-actin (G) and Yap (H). (I) Quantification changes in intracellular localization of Yap and F-actin across the PD axis by expressing a ratio between average intensities of proximal:distal Yap or F-actin of xz projections of respective mesenchymal cells. Mean±s.d. are shown. Dashed lines indicate amputation plane. n=7 sections, 5 fish. Scale bars: 50µm.
|
