
Fig. S4
- ID
- ZDB-FIG-151022-14
- Publication
- Mateus et al., 2015 - Control of tissue growth by Yap relies on cell density and F-actin in zebrafish fin regeneration
- Other Figures
- All Figure Page
- Back to All Figure Page
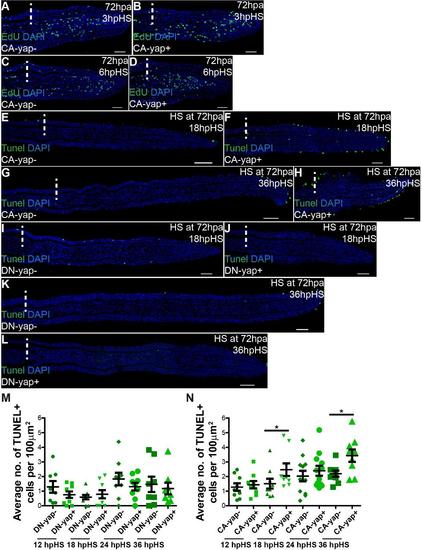
Cell death occurs after the proliferative boost in CA-Yap transgenics but not in DN-Yap transgenics. A-D Representative immunofluorescence with EdU in 72 hpa longitudinal sections of CA-yap sibling controls (A) and CA-yap positive fish (B) at 3 hours post single heat-shock (hpHS); CA-yap sibling controls (C) and CA-yap positive fish (D) at 6 hpHS. Representative immunofluorescence with Tunel in 90 and 108 hpa longitudinal sections of CA-yap sibling controls (E,G), CA-yap positive (F,H), DN-yap sibling controls (I,K) and DN-yap positive transgenics (J,L). Scale bars correspond to 50µm. M-N Quantification of average Tunel positive cells occurring per 100µm2 in DN-yap and siblings (M) and CA-yap and siblings (N), at different times post amputation, after a single heat-shock at 72 hpa. *P value<0.05, two tailed, non-parametric Mann-Whitney test. n=9 sections, 3 fish per condition. Dashed lines indicate amputation plane. |