
Fig. S5
- ID
- ZDB-FIG-151022-15
- Publication
- Mateus et al., 2015 - Control of tissue growth by Yap relies on cell density and F-actin in zebrafish fin regeneration
- Other Figures
- All Figure Page
- Back to All Figure Page
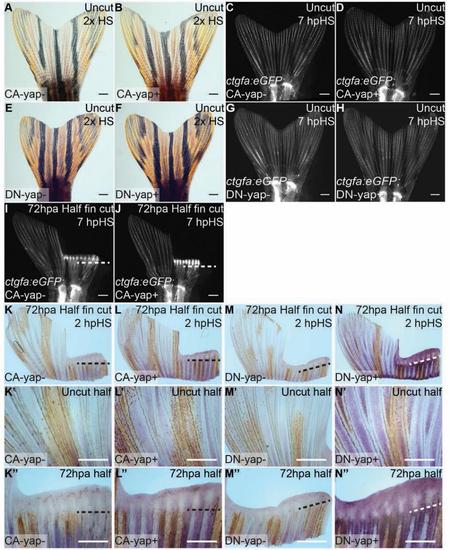
Yap is not activated in a homeostatic context. A-B, E-F Representative brightfield images of uninjured CA-yap/DN-yap transgenics upon heat-shock in 2 consecutive days, phenotypes were accessed the next day. A CA-yap control; (B) CA-yap+; (E) DN-yap control; F DN-yap+. C-D, G-H, I-J Representative ctgfa expression in double transgenics ctgfa:eGFP; CA-yap/DN-yap and siblings upon heat-shock in uncut or 72 hpa half amputated fin animals, at 7 hpHS. C CA-yap control; (D) CA-yap+; (G) DN-yap control; (H) DN-yap+; (I) CA-yap control; (J) CA-yap+. n=5 fish/ condition. K-N Representative in situ hybridizations for yap1 in 72 hpa half amputated fins of CA-yap control (K), CA-yap+ (L), DN-yap control (M), DN-yap+ (N). Corresponding zooms of uncut half (K′-N′), 72 hpa regenerate half (K′′-N′′) of in situs shown in K-N, highlighting yap1 differences in CA-yap/DN-yap transgenics versus siblings. Fins were collected at 2 hpHS. n=3 fins/condition. Scale bars=500µm. Dashed lines indicate amputation plane. |