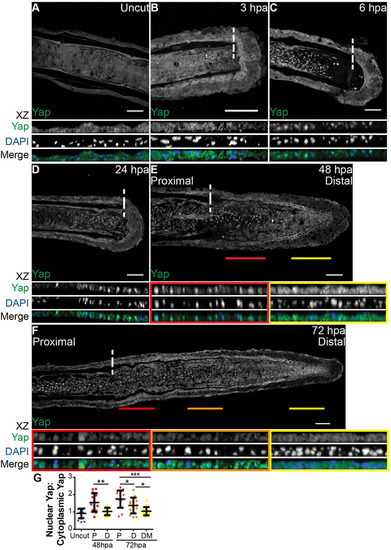
Yap is present and highly dynamic during fin regeneration. (A-F) Representative immunostaining with anti-Yap in caudal fin longitudinal sections at several regenerative stages. (A) Uncut control; (B) 3hpa; (C) 6hpa; (D) 24hpa; (E) 48hpa; (F) 72hpa. xz projections of mesenchymal regions highlight Yap intracellular localization. Distal (yellow) and proximal (red) lines at 48hpa (E), and distal-most (yellow), distal (orange) and proximal (red) lines at 72hpa (F), correspond to the mesenchymal areas in the medial blastema where xz projections were made (shown below). Dashed lines indicate amputation plane. n=10-15 sections; 5 fish/condition. Scale bars: 50µm. (G) Quantification of Yap intracellular localization by expressing a ratio between average intensities of nuclear Yap:cytoplasmic Yap of xz projections from blastemas at different time points. Higher ratios correspond to higher intensities of nuclear Yap. P corresponds to xz of proximal (red); D to distal (orange); DM to distal-most regions (yellow). *P<0.05, **P<0.01, ***P<0.001; two-tailed, non-parametric Mann–Whitney test. n=15 sections, 5 fish/condition. Mean±s.d. are shown.
|
