
Fig. 4
- ID
- ZDB-FIG-151013-10
- Publication
- Ernest et al., 2015 - A genomic region encompassing a newly identified exon provides enhancing activity sufficient for normal myo7aa expression in zebrafish sensory hair cells
- Other Figures
- All Figure Page
- Back to All Figure Page
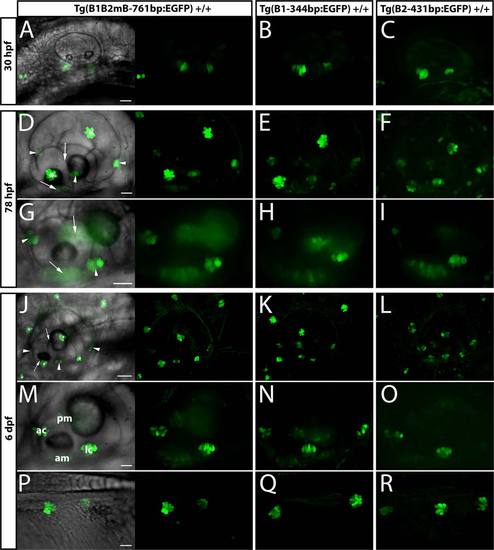
Expression of EGFP in fish transgenic for B1B2mB-761bp, B1-344bp and B2-431bp DNA fragments. Lateral views of homozygous transgenic zebrafish embryos. Panels A,D,G,J,M,P: line Tg(B1B2mB-761bp:EGFP); panels B,E,H,K,N,Q: line Tg(B1-344bp:EGFP); panels C,F,I,L,O,R: line Tg(B2-431bp:EGFP). Each transgenic line was derived from one founder F0 fish: founder #2A for the B1B2mB-761bp DNA fragment (out of 3 F0 founders), founder #5B for the B1-344bp DNA fragment (out of 3 F0 founders) and founder #7B, the unique F0 founder for B2-431bp DNA fragment. Live embryos were anesthetized with tricaine and mounted in agarose before imaging on a Leica spinning disk microscope. All images are z-axis projections. Embryonic stages imaged were: 30 hpf (A–C), 78 hpf (D–I), 6 dpf (J–R). Panels A,D,G,J,M,P comprise the superimposition of bright field with fluorescence image (left part) and the fluorescence image (right part) of the exact same area of the embryo. For Tg(B1-344bp) and Tg(B2-431bp) transgenic zebrafish, only fluorescent image of the same embryonic area is shown. (D,G,J) arrow = anterior or posterior maculae; arrowhead = anterior, lateral or posterior cristae; * = neuromast. (M) am = anterior maculae; pm = posterior maculae; ac = anterior cristae; lc = lateral cristae. Scale bar: 20 µm in all panels except for panels J (50 µm). |