
Fig. 1
- ID
- ZDB-FIG-151006-1
- Publication
- Nguyen Chi et al., 2015 - Identification of polarized macrophage subsets in zebrafish
- Other Figures
- All Figure Page
- Back to All Figure Page
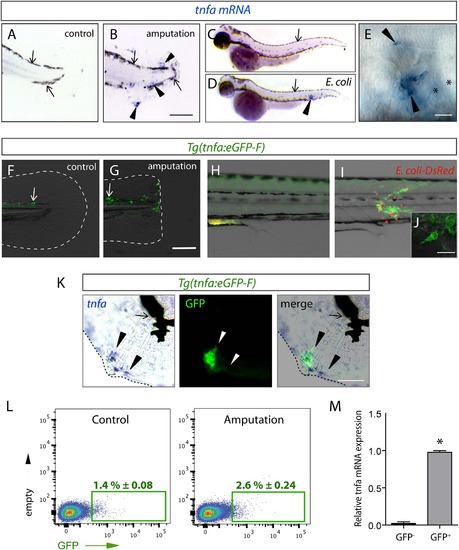
The (tnfa:eGFP-F) reporter line recapitulates transcriptional activation of tnfa upon wound-induced inflammation and Escherichia coli infection. (A–E) Tumour necrosis factor alpha (tnfa) mRNA expression (blue, arrowhead) was detected by in situ hybridization using tnfa anti-sense probe: at 6 hpA in (A) intact (control) and (B) amputated fins from 3 dpf WT larvae, (C) in uninfected larvae (54 hpf, hours post-fertilization) and (D, E) E. coli infected larvae (24 hpi, 54 hpf). Arrows show melanocytes (black). (E) Imaging of tnfa mRNA expression in the muscle at higher magnification, asterisks show muscle fibres, scale bar in (B) = 100 µm and in (E) = 50 µm. (F, G) eGFP fluorescence (green) was analyzed by fluorescent microscopy in (F) intact (control) and (G) amputated Tg(tnfa:eGFP-F) fins at 6 hpA, dotted lines outline the caudal fin, scale bar = 100 µm and at 16 hpi in Tg(tnfa:eGFP-F) larvae injected with (H) PBS or (I, J) E. coli (red) in the muscle. Arrows show auto-fluorescent xanthophores. (J) Multi-scan confocal analysis of GFP expression in E. coli-infected Tg(tnfa:eGFP-F) larvae, scale bar = 20 µm. (K) tnfa mRNA and eGFP-F expressions were analyzed using microscopy at 6 hpA in amputated fins from 3 dpf Tg(tnfa:eGFP-F) larvae. Dotted lines delimit the caudal fin, arrowheads show overlapping signals, and arrows show the pigments. Scale bar = 100 µm. (L) Graphed data of representative fluorescence-activated flow cytometry analysis of eGFP+ cells in upon amputation. Tg(tnfa:eGFP-F) larvae were either kept intact (control) or amputated at 3 dpf, and cells were collected at 6 hr post-treatment. Green gates represent eGFP+ population and mean percentage of eGFP+ population ±s.e.m is indicated. (M) Relative expression of tnfa in eGFP- and GFP+ cells in amputated larvae. Real-time RT-PCR on separated cells using EF1a as a reference gene. Graph represents the mean value of three independent experiments ±s.e.m. *p < 0.05. |
| Genes: | |
|---|---|
| Fish: | |
| Conditions: | |
| Anatomical Terms: | |
| Stage Range: | Long-pec to Protruding-mouth |