
Fig. 4, S1
- ID
- ZDB-FIG-151006-4
- Publication
- Nguyen Chi et al., 2015 - Identification of polarized macrophage subsets in zebrafish
- Other Figures
- All Figure Page
- Back to All Figure Page
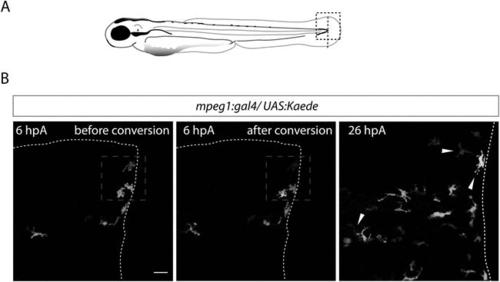
Recruited macrophages remain in the region of tissue injury at 26 hpA. (A) Diagram showing the site where caudal fin was transected (dotted red line) in 3 dpf Tg(mpeg1:GAL4/UAS:Kaede) larvae. The black dotted box represents the region imaged by confocal microscopy. (B) Representative maximum projections of confocal analysis of Kaede (green and red) expression in recruited macrophages at 6 hpA in Tg(mpeg1:GAL4/UAS:Kaede) fins. Images were acquired before photoconversion at 6 hpA (left panel), immediately after photoconversion at 6 hpA (middle panel), and at 26 hpA (right panel). The blue dashed boxes represent the region that was scanned using UV laser allowing photoconversion of few macrophages at the wound leaving them with red fluorescence rather than green. Arrowheads show the traced and photoconverted macrophages at 26 hpA and white dotted line outline the amputated fin. (ncells = 13, nlarvae = 5) Scale bar = 20 µm. |
| Gene: | |
|---|---|
| Fish: | |
| Condition: | |
| Anatomical Term: | |
| Stage Range: | Protruding-mouth to Day 4 |