
- Title
-
Identification of polarized macrophage subsets in zebrafish
- Authors
- Nguyen Chi, M., Laplace-Builhe, B., Travnickova, J., Luz-Crawford, P., Tejedor, G., Phan, Q.T., Duroux-Richard, I., Levraud, J.P., Kissa, K., Lutfalla, G., Jorgensen, C., Djouad, F.
- Source
- Full text @ Elife
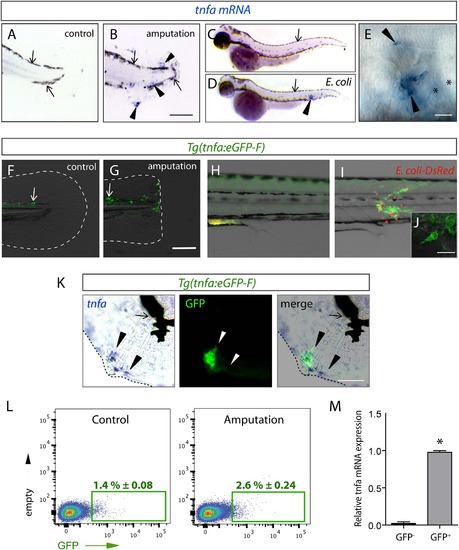
The (tnfa:eGFP-F) reporter line recapitulates transcriptional activation of tnfa upon wound-induced inflammation and Escherichia coli infection. (A–E) Tumour necrosis factor alpha (tnfa) mRNA expression (blue, arrowhead) was detected by in situ hybridization using tnfa anti-sense probe: at 6 hpA in (A) intact (control) and (B) amputated fins from 3 dpf WT larvae, (C) in uninfected larvae (54 hpf, hours post-fertilization) and (D, E) E. coli infected larvae (24 hpi, 54 hpf). Arrows show melanocytes (black). (E) Imaging of tnfa mRNA expression in the muscle at higher magnification, asterisks show muscle fibres, scale bar in (B) = 100 µm and in (E) = 50 µm. (F, G) eGFP fluorescence (green) was analyzed by fluorescent microscopy in (F) intact (control) and (G) amputated Tg(tnfa:eGFP-F) fins at 6 hpA, dotted lines outline the caudal fin, scale bar = 100 µm and at 16 hpi in Tg(tnfa:eGFP-F) larvae injected with (H) PBS or (I, J) E. coli (red) in the muscle. Arrows show auto-fluorescent xanthophores. (J) Multi-scan confocal analysis of GFP expression in E. coli-infected Tg(tnfa:eGFP-F) larvae, scale bar = 20 µm. (K) tnfa mRNA and eGFP-F expressions were analyzed using microscopy at 6 hpA in amputated fins from 3 dpf Tg(tnfa:eGFP-F) larvae. Dotted lines delimit the caudal fin, arrowheads show overlapping signals, and arrows show the pigments. Scale bar = 100 µm. (L) Graphed data of representative fluorescence-activated flow cytometry analysis of eGFP+ cells in upon amputation. Tg(tnfa:eGFP-F) larvae were either kept intact (control) or amputated at 3 dpf, and cells were collected at 6 hr post-treatment. Green gates represent eGFP+ population and mean percentage of eGFP+ population ±s.e.m is indicated. (M) Relative expression of tnfa in eGFP- and GFP+ cells in amputated larvae. Real-time RT-PCR on separated cells using EF1a as a reference gene. Graph represents the mean value of three independent experiments ±s.e.m. *p < 0.05. EXPRESSION / LABELING:
|
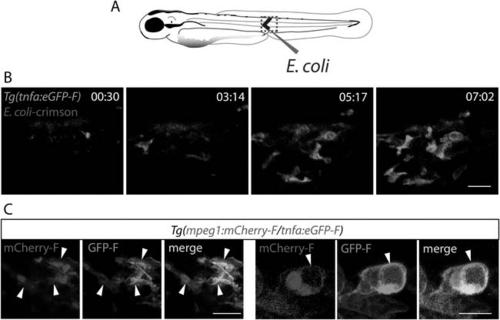
Activation of tnfa+ macrophages in (tnfa:eGFP-F/mpeg1:mCherry-F) transgenic larvae upon E. coli infection. (A) Diagram showing the site where Crimson E. coli or non-fluorescent E. coli (blue) were injected in the muscle of 3 dpf Tg(mpeg1:mCherryF/tnfa:eGFP-F) larvae. The red dotted box represents the region imaged by confocal microscopy. (B) Tg(mpeg1:mCherryF/tnfa:eGFP-F) larvae were infected with crimson-expressing E. coli (blue) at 3 dpf in the muscle and imaged from 30 min pi to 10 hr 30 min pi every 3 min 30 s. Representative time-lapse maximum projections show the expression of tnfa (green) induced in myeloid-like cells at the infection site from 3 hpA. The time pA is shown on top right corner, scale bar = 25 µm. (C) Maximum projections of confocal analysis of GFP-F (green) and mCherryF (red) expressions in Tg(mpeg1:mCherryF/tnfa:eGFP-F). Larvae were previously infected with E. coli at 3 dpf in the muscle and imaged at 6 hpi. Arrowheads show macrophages expressing tnfa. Scale bar on left panels = 20 µm and on right panels = 10 µm. EXPRESSION / LABELING:
|
Activation of tnfa+ macrophages in (tnfa:eGFP-F/mpeg1:mCherry-F) transgenic larvae upon E. coli infection. (A) Diagram showing the site where Crimson E. coli or non-fluorescent E. coli (blue) were injected in the muscle of 3 dpf Tg(mpeg1:mCherryF/tnfa:eGFP-F) larvae. The red dotted box represents the region imaged by confocal microscopy. (B) Tg(mpeg1:mCherryF/tnfa:eGFP-F) larvae were infected with crimson-expressing E. coli (blue) at 3 dpf in the muscle and imaged from 30 min pi to 10 hr 30 min pi every 3 min 30 s. Representative time-lapse maximum projections show the expression of tnfa (green) induced in myeloid-like cells at the infection site from 3 hpA. The time pA is shown on top right corner, scale bar = 25 µm. (C) Maximum projections of confocal analysis of GFP-F (green) and mCherryF (red) expressions in Tg(mpeg1:mCherryF/tnfa:eGFP-F). Larvae were previously infected with E. coli at 3 dpf in the muscle and imaged at 6 hpi. Arrowheads show macrophages expressing tnfa. Scale bar on left panels = 20 µm and on right panels = 10 µm. |
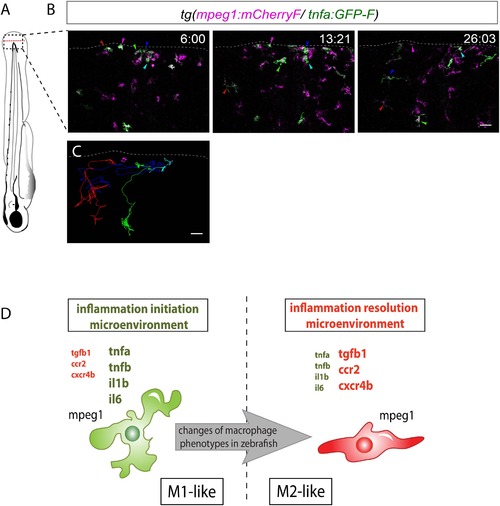
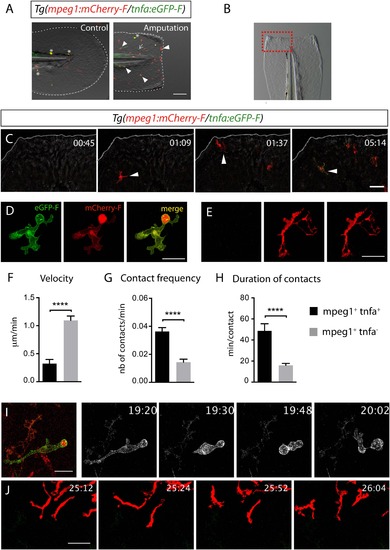
M1-like macrophages convert their phenotype toward M2-like phenotype in the wounded fin. (A) Diagram showing the site where caudal fin was transected (dotted red line) in 3 dpf Tg(mpeg1:mCherryF/tnfa:eGFP-F) larvae. The black dotted box represents the region imaged by confocal microscopy. (B) Representative time-lapse maximum projections of 3 dpf Tg(mpeg1:mCherryF/tnfa:eGFP-F) amputated fins showing the fate of tnfa+ macrophages (magenta + green) at the indicated times pA (hours:minutes) from 6 hpA to 26 hpA. White lines delimit the caudal fin. Scale bar = 30 µm. (C) Tracking of tnfa+ macrophages from 6 to 26 hpA. The distinct colours of the lines correspond to the distinct macrophages that were indicated with an arrowhead in B. (D) Diagram representing macrophage activation and polarization in zebrafish. Unpolarized macrophages (mpeg1+) are mobilized and recruited to the wound following fin amputation. They are activated and polarized toward a M1-like phenotype (pro-inflammatory) few hours following fin amputation. After 24 hpA, in response to changes in environmental cues, the same macrophages progressively change their phenotype toward intermediate phenotypes and maybe fully polarized M2-like phenotype (non-inflammatory). Main markers of macrophage subtypes are indicated and resemble those found in human (tnfa/b indicates tumour necrosis factor alpha; il1b, interleukin 1-beta; il6, interleukin 6; tgfb1, tumour growth factor beta 1; ccr2, c–c chemokine receptor type 2; cxcr4b, chemokine (C-X-C motif) receptor 4b). EXPRESSION / LABELING:
|
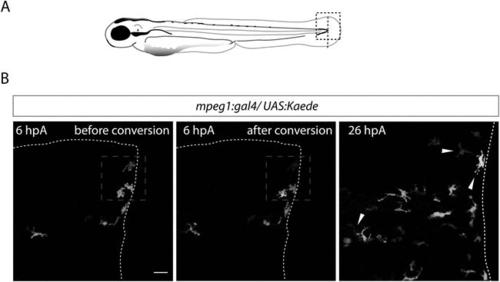
Recruited macrophages remain in the region of tissue injury at 26 hpA. (A) Diagram showing the site where caudal fin was transected (dotted red line) in 3 dpf Tg(mpeg1:GAL4/UAS:Kaede) larvae. The black dotted box represents the region imaged by confocal microscopy. (B) Representative maximum projections of confocal analysis of Kaede (green and red) expression in recruited macrophages at 6 hpA in Tg(mpeg1:GAL4/UAS:Kaede) fins. Images were acquired before photoconversion at 6 hpA (left panel), immediately after photoconversion at 6 hpA (middle panel), and at 26 hpA (right panel). The blue dashed boxes represent the region that was scanned using UV laser allowing photoconversion of few macrophages at the wound leaving them with red fluorescence rather than green. Arrowheads show the traced and photoconverted macrophages at 26 hpA and white dotted line outline the amputated fin. (ncells = 13, nlarvae = 5) Scale bar = 20 µm. EXPRESSION / LABELING:
|