
FIGURE
Fig. 7
- ID
- ZDB-FIG-150413-7
- Publication
- Banerjee et al., 2015 - Zebrafish foxc1a drives appendage-specific neural circuit development
- Other Figures
- All Figure Page
- Back to All Figure Page
Fig. 7
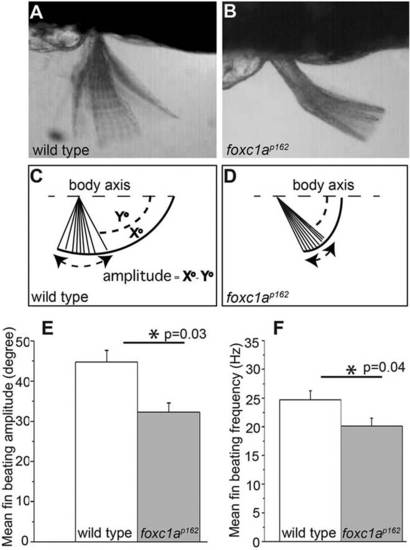
foxc1a mutants exhibit reduced fin mobility. (A,B) Time projections from high-speed video recordings of 96hpf wild type and foxc1a mutants reveal reduced pectoral fin mobility. (C,D) To quantify the defects, we defined the fin-beating amplitude as X°-Y°, where X° designates the maximum elevation angle of fin with respect to body axis (dashed line) in a given beating cycle, and Y° denotes the maximum depression angle in a given beating cycle. (E,F) foxc1a mutants display a significant reduction of both beating amplitude and frequency of pectoral fins. (C,F,I) Asterisks indicate P<0.05 (Student′s t-test). |
Expression Data
Expression Detail
Antibody Labeling
Phenotype Data
| Fish: | |
|---|---|
| Observed In: | |
| Stage: | Day 4 |
Phenotype Detail
Acknowledgments
This image is the copyrighted work of the attributed author or publisher, and
ZFIN has permission only to display this image to its users.
Additional permissions should be obtained from the applicable author or publisher of the image.
Full text @ Development