
FIGURE
Fig. 1
- ID
- ZDB-FIG-141113-19
- Publication
- Hao et al., 2013 - Identification of Estrogen Target Genes during Zebrafish Embryonic Development through Transcriptomic Analysis
- Other Figures
- All Figure Page
- Back to All Figure Page
Fig. 1
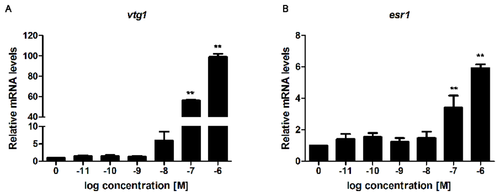
Dose-response curves of vtg1 and esr1 expression in zebrafish embryos. Zebrafish embryos were treated with increasing doses of E2 continuously for 4 days and the mRNA expression levels were determined by RT-qPCR. (A) Relative vtg1 mRNA expression. (B) Relative esr1 mRNA expression. Asterisk denotes significant differences (**P<0.01; unpaired Student’s t-test compared to the controls; n=2 biological replicates; 3 technical replicates within each biological replicate). Abbreviations vtg1: vitellogenin 1 and esr1: estrogen receptor 1. |
Expression Data
| Genes: | |
|---|---|
| Fish: | |
| Condition: | |
| Anatomical Term: | |
| Stage: | Day 4 |
Expression Detail
Antibody Labeling
Phenotype Data
Phenotype Detail
Acknowledgments
This image is the copyrighted work of the attributed author or publisher, and
ZFIN has permission only to display this image to its users.
Additional permissions should be obtained from the applicable author or publisher of the image.
Full text @ PLoS One