
FIGURE
Fig. 5
- ID
- ZDB-FIG-141016-36
- Publication
- Hao et al., 2013 - Identification of Estrogen Target Genes during Zebrafish Embryonic Development through Transcriptomic Analysis
- Other Figures
- All Figure Page
- Back to All Figure Page
Fig. 5
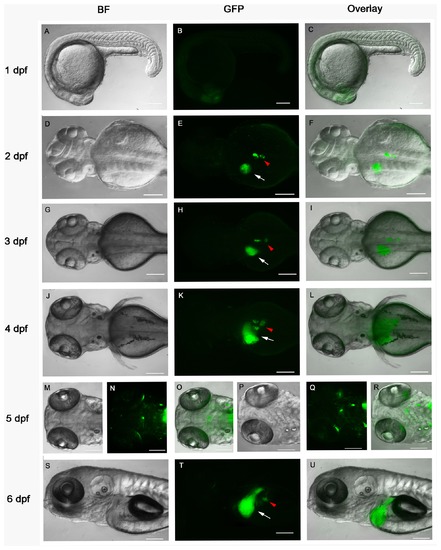
Developmental dynamics of E2 responsive tissues in Tg(5xERE:GFP) transgenic fish. Zebrafish larvae were treated with 1 μM E2 (in 0.1% DMSO) from 3 hpf and imaged at 1 dpf (A-C), 2 dpf (D-F), 3 dpf (G-I), 4 dpf (J-L), 5 dpf (M-R) and 6 dpf (S-U). Arrows (white) indicate the liver; arrowheads (red) indicate the pancreas. A, D, G, J, M, P and S, bright-field images; B, E, H, K, N, Q and T corresponding GFP fluorescence images; C, F, I, L, O, R and U, overlay of bright-field and GFP images. A-C and S-U, lateral view; D-O, dorsal view; P-R, ventral view; anterior to the left. Scale bars, 100 μm. |
Expression Data
| Gene: | |
|---|---|
| Fish: | |
| Condition: | |
| Anatomical Terms: | |
| Stage Range: | Long-pec to Day 6 |
Expression Detail
Antibody Labeling
Phenotype Data
Phenotype Detail
Acknowledgments
This image is the copyrighted work of the attributed author or publisher, and
ZFIN has permission only to display this image to its users.
Additional permissions should be obtained from the applicable author or publisher of the image.
Full text @ PLoS One