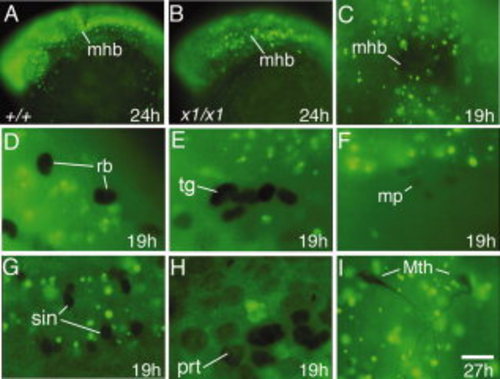
Patterns of bromodeoxyuridine (BrdU) incorporation. A–I: Images show lateral views with anterior to the left (A,B,E,F,H) or dorsal views with anterior to the top (C,I) or to the left (D,G). A,B: Head region of a wild-type embryo and harpy mutant incubated with BrdU from 18 to 24 hr. Note that the majority of cells incorporate BrdU in both mutant and wild-type embryos. C–I: harpy mutants injected with BrdU at 12 hr and fixed later at 19 hr. Note that in all the cases shown, cells that express the indicated marker of differentiation (black) never incorporate BrdU (green). C: Anti-Engrailed stained midbrain–hindbrain border. D,E: Anti-Isl1/2 staining showing Rohon-Beard sensory neurons and trigeminal ganglia. F: Anti-Engrailed stained muscle pioneers. G: Anti-Pax2 stained spinal interneurons. H: Anti-Pax2 stained pronephric cells. I: 3A10 antibody-stained Mauthner neurons; these were fixed at 27 hr. mhb, midbrain–hindbrain border; mp, muscle pioneers; Mth, Mauthner neurons; prt, pronephros; sin, spinal interneurons; rb, Rohon-Beard sensory neurons; tg, trigeminal ganglia. Scale bar = 100 μm in A,B, 75 μm in C, 30 μm in D–G,I, 15 μm in H.
|
