
Fig. 2
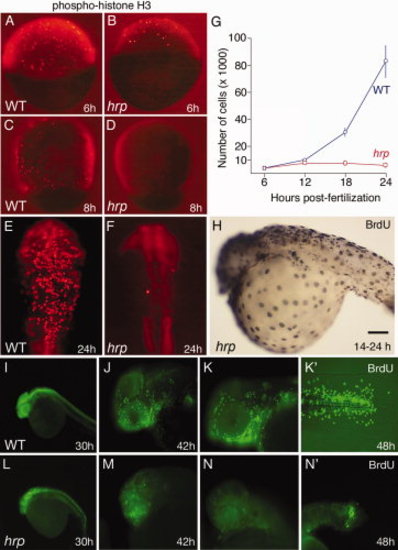
Cycle characterization of cells in harpy mutants. A–F: Anti-phospho-histone H3 (pH3) staining in wild-type and harpy mutant embryos from 6 through 24 hr showed that typically by 8 hr no cells are in mitosis. Only occasional cells were pH3 positive at 24 hr (F). G: Mean number of cells per embryo, based on cell counts. Cells were counted after dissociating individual embryos with collagenase. Each time point shows the mean and standard deviation from 10 embryos. H–N: Bromodeoxyuridine (BrdU) incorporation in wild-type and harpy mutant embryos. H shows an harpy mutant injected at 14 hr and fixed 10 hr later. I–N shows embryos injected and fixed 45 min later. Note that at 30 and 42 hr many cells were positive in mutants; however, at 48 hr, mutants were mostly negative except for a small focus of BrdU incorporation in the tail. Scale bar = 100 μm in A–F, 85 μm in H,J,K,M,N, 200 μm in I,L. |
| Fish: | |
|---|---|
| Observed In: | |
| Stage Range: | Shield to Long-pec |